First Run
This documentation helps you to do a first run with the SimStadt application and explains the basics of the graphical user interface (GUI).
1. Launch SimStadt
After all required programs (Java 17, INSEL, SimStadt.zip, etc.) are installed on your computer, open the unzipped SimStadt folder (normally named "SimStadt_0.10.0-SNAPSHOT_xxxxxx"). This should look like this:
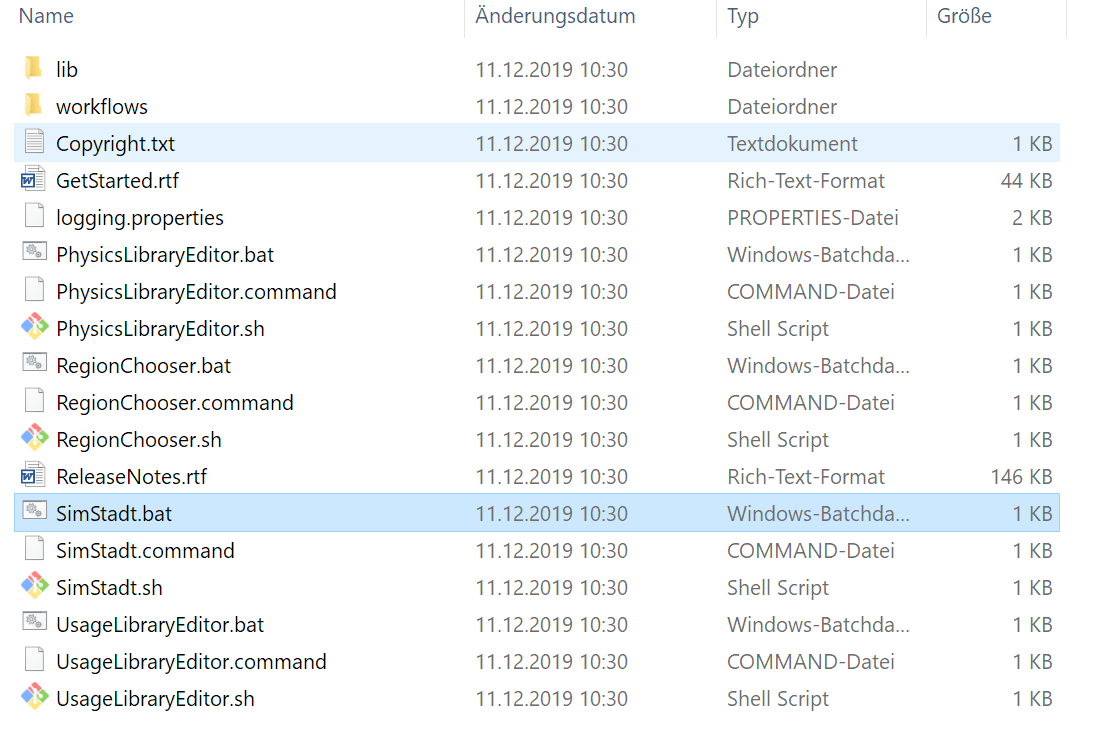
To start SimStadt on Windows you double click on: "SimStadt.bat". Linux users please use the "SimStadt.sh", macOS users double click on "SimStadt.command". RegionChooser, PhysicsLibraryEditor and UsageLibraryEditor are also available.
2. User interface
When opening SimStadt you see the following GUI (Graphical User Interface) with the menu bar and three subwindows.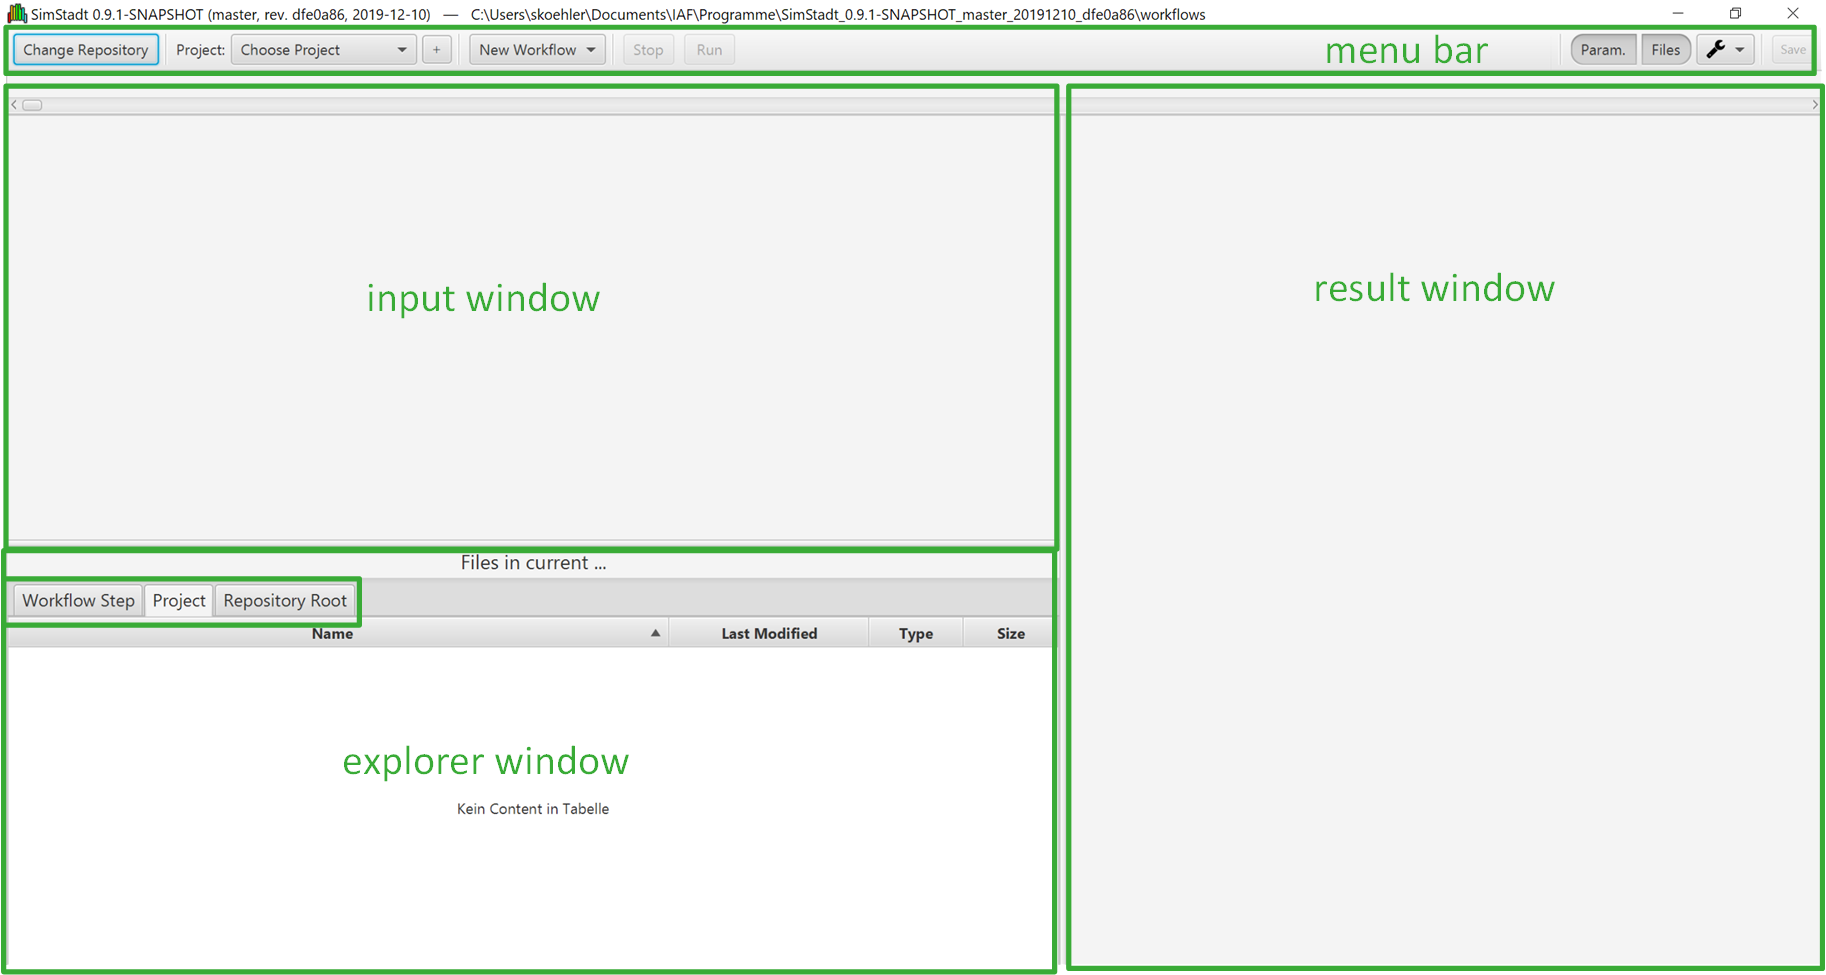
In the menu bar you choose :
- the location of your repository
- One of the projects, located inside the repository.
- The type of workflow.
The upper left window is the input/parameter window for CityGML files. CityGML files are the basic input for the SimStadt application. They contain information about the geography, the geometry and the attributes of buildings.
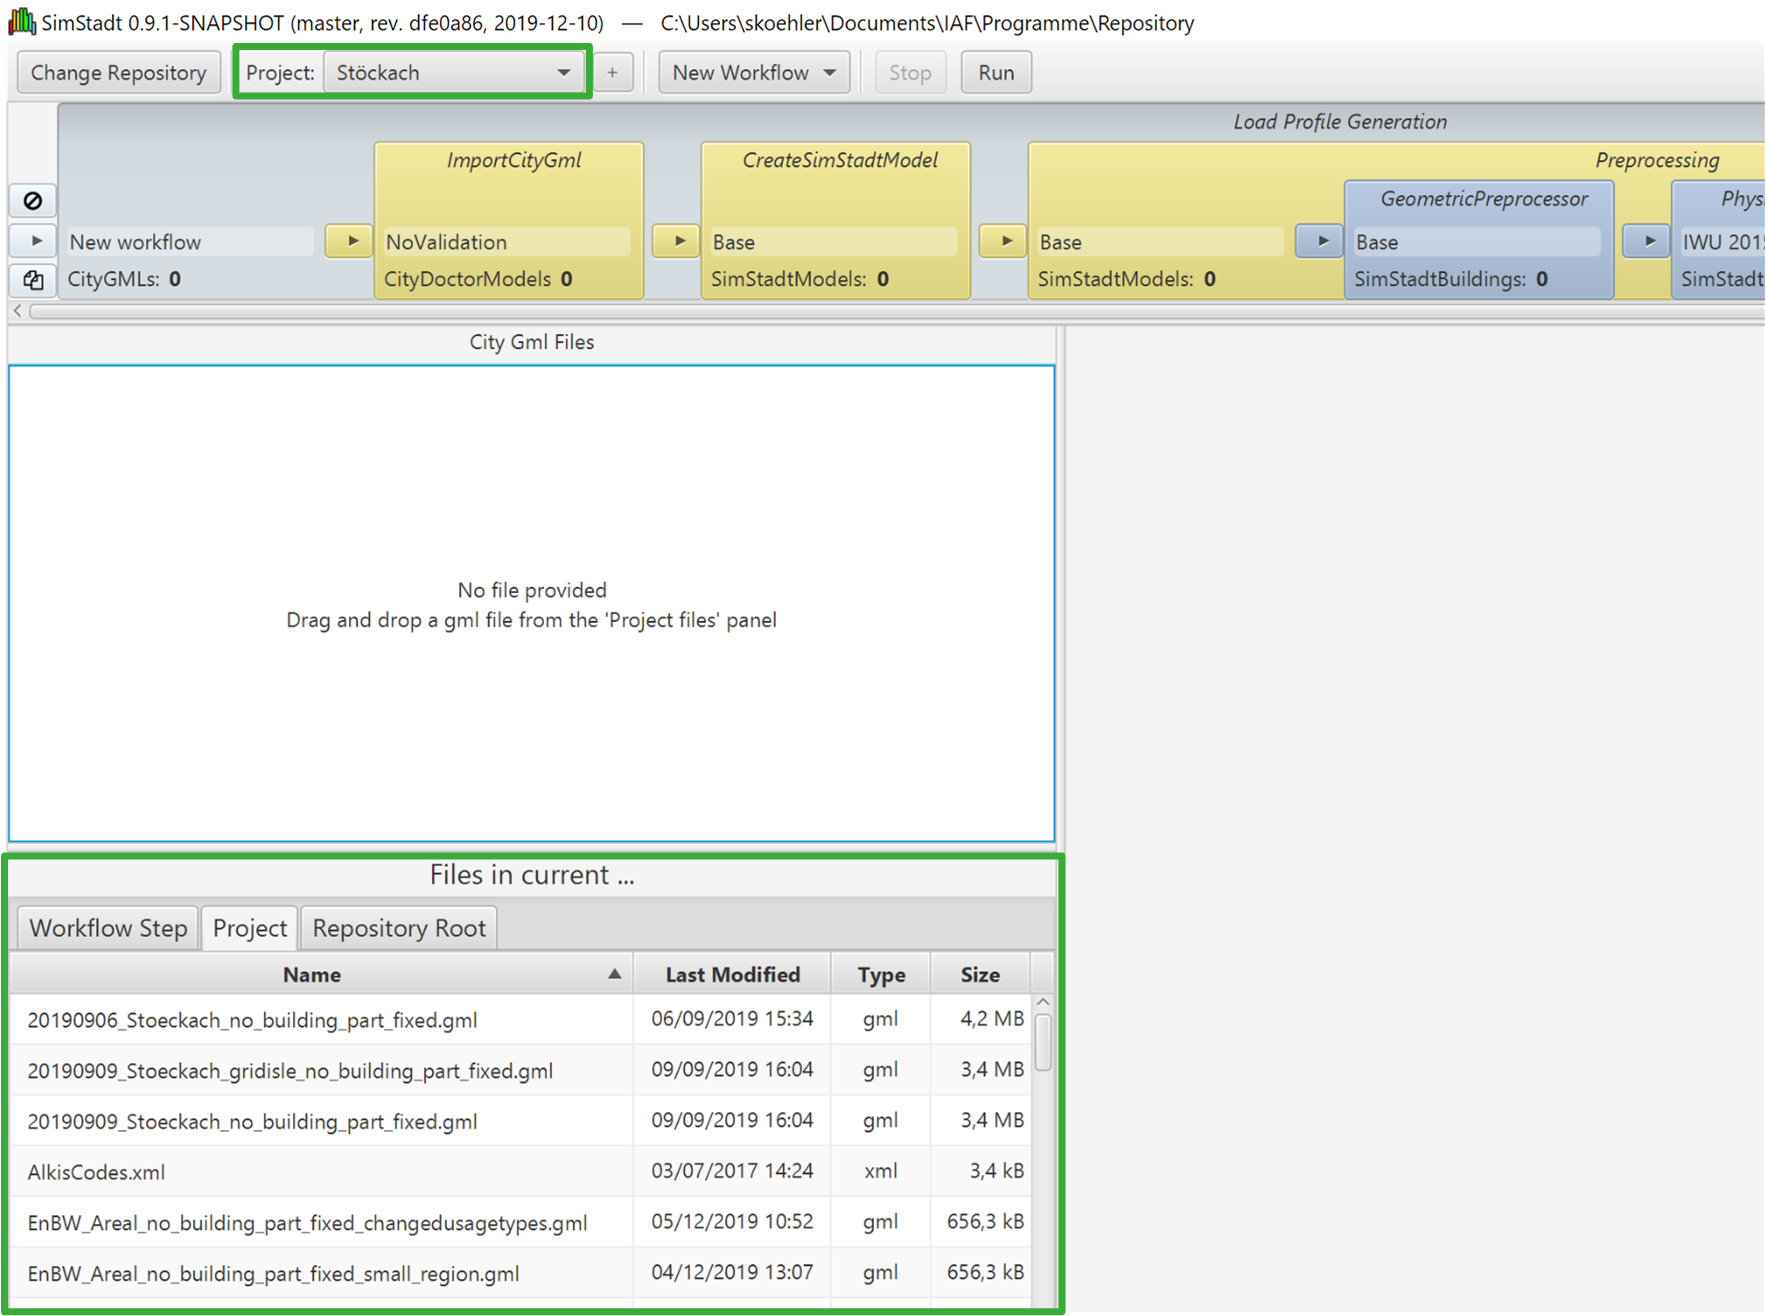
The bottom left window works as a sort of explorer window/file viewer, with three tabs.
-
The "Workflow Step" tab will contain all the created output files, after a simulation run.
-
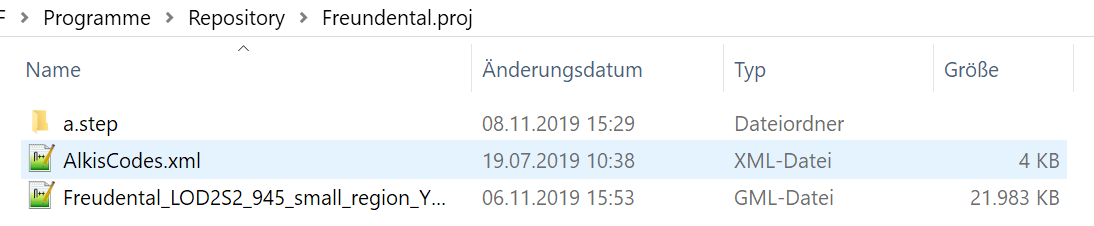
In the "Project" tab you will find all files that are saved in your SimStadt project folder. Usually the project folder contains different CityGML files and sometimes a ALKIS translation file in .xml format and a weather file in .tmy3 format.
-
"Repository Root" with files common to every project.
The large right hand side window will graphically display the results either as chart or as 2D Map.
3. Choose a repository
Before you can run SimStadt you have to choose a path where your repository is found. For a start, you can use a test repository. When you open the folder in your explorer you will find different projects named xxx.proj.
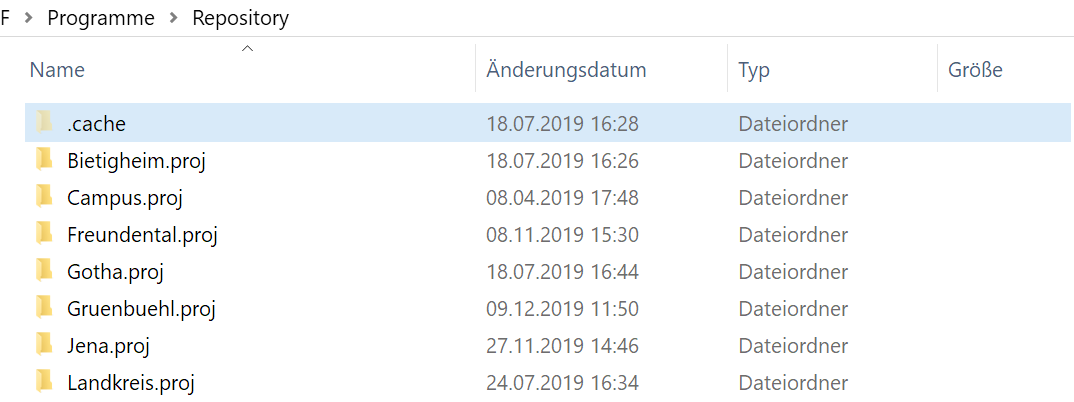
The project folder contains CityGML files and - if necessary- a ALKIS translation file in .xml format and a weather file in .tmy3 format. A CityGML file can be extracted with RegionChooser.
To select the path to your repository click on the button "Change Repository" in the menu bar. You will be forwarded to your explorer. There you define the path to your repository and click "select folder".

4. Select a project and a workflow
After you have chosen the location of your repository, you select a project by clicking on the drop down bottom. Here you should see all your projects listed that your repository folder contains.
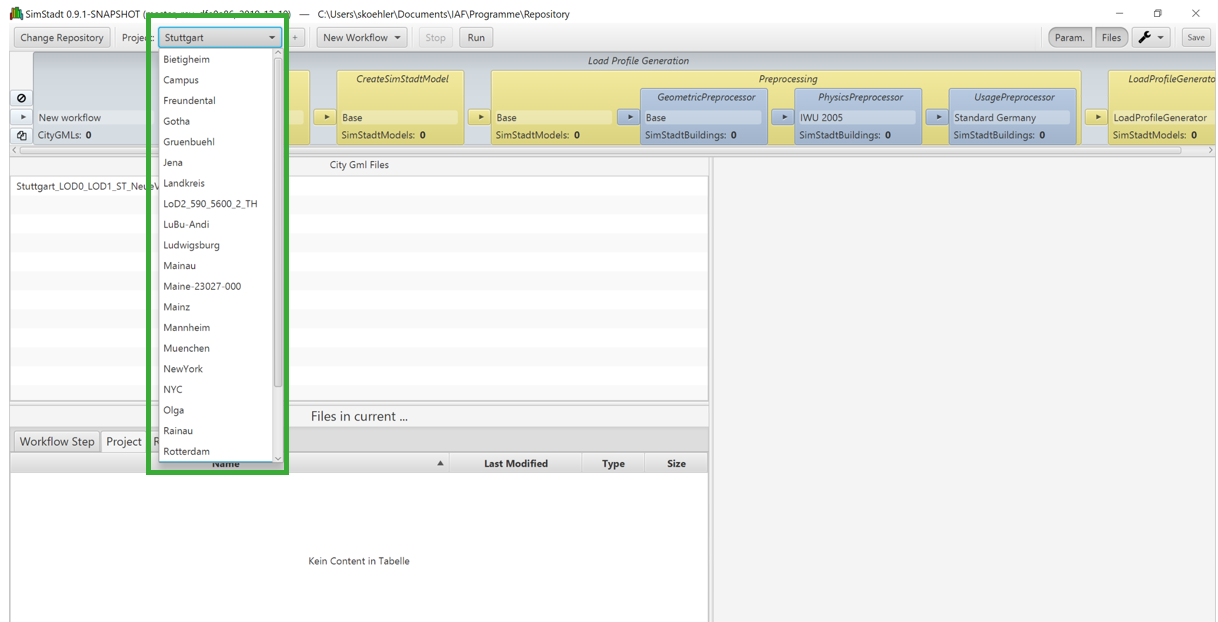
By clicking on a project name you select the project. The tab "Project" in the explorer window should now display all the files that are in the specific project folder. You will not see any projects or files if the connection to your repository is not correctly established.
After picking a project, you select a workflow also by clicking on the drop down arrow, where all the available workflows are listed.
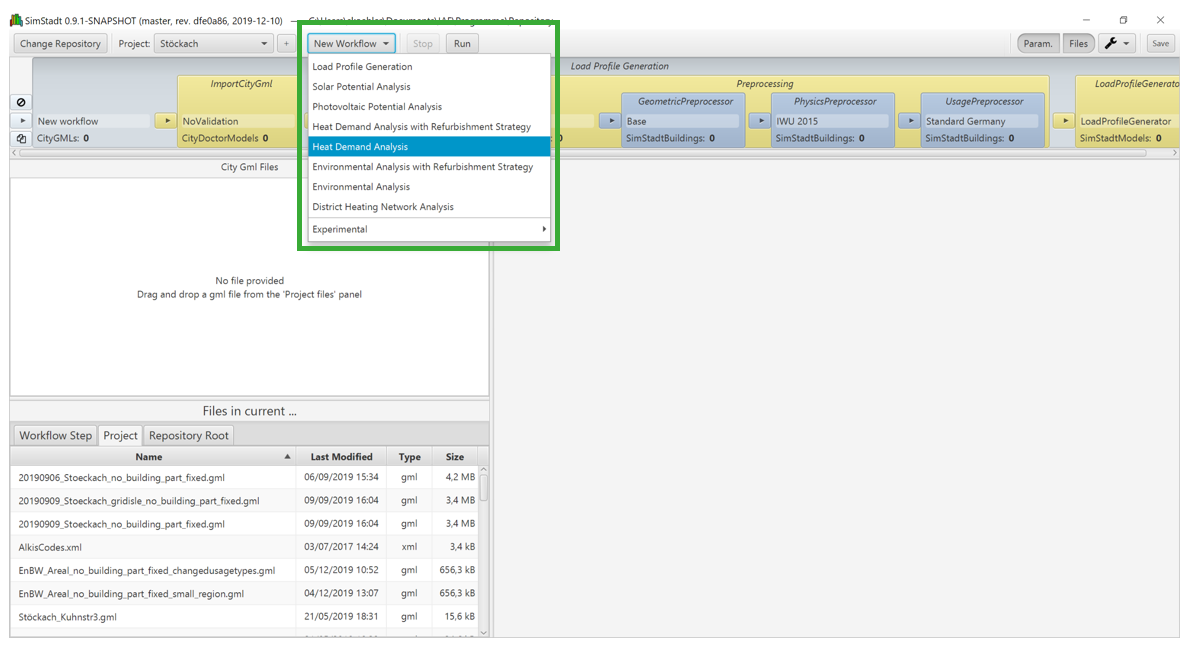
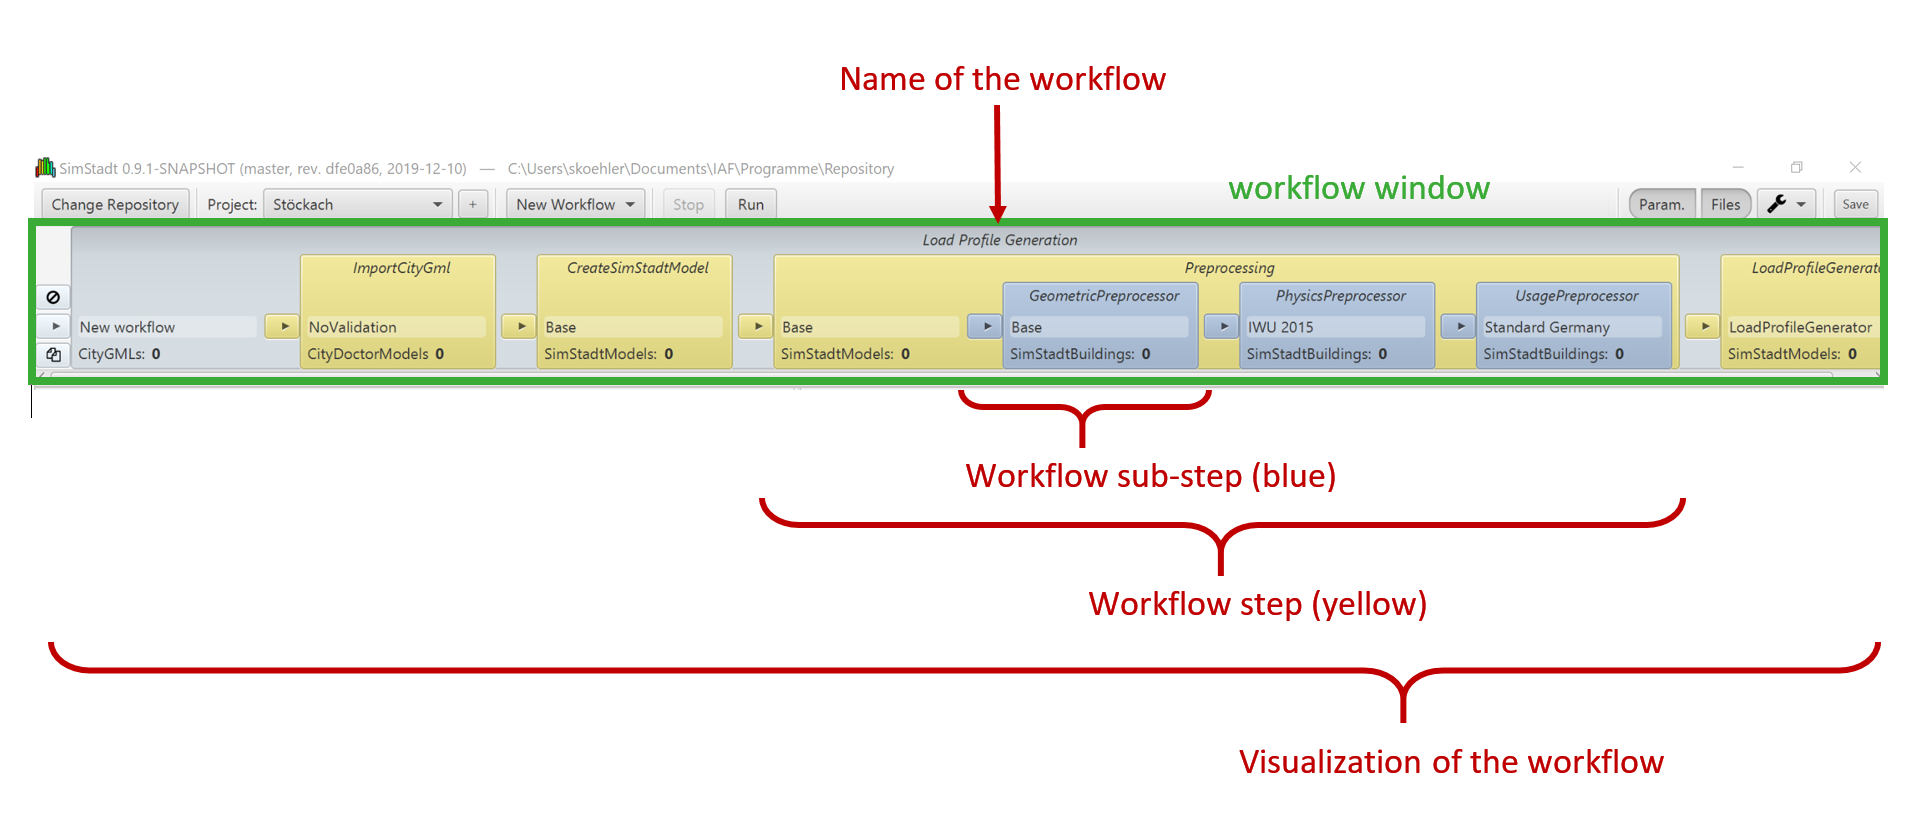
The chosen workflow should be displayed in a new window between the menu bar and the other windows. This window is called the workflow window. The workflow window contains all the workflow steps and workflow sub-steps that are required to run a workflow.
You might have noticed that also your GUI has extended with another window, the workflow window during this process.
5. First Run
To successfully run SimStadt now you only drag and drop a CityGML file from the "Project" tab of the explorer window into the input window. The input window should display the chosen file.
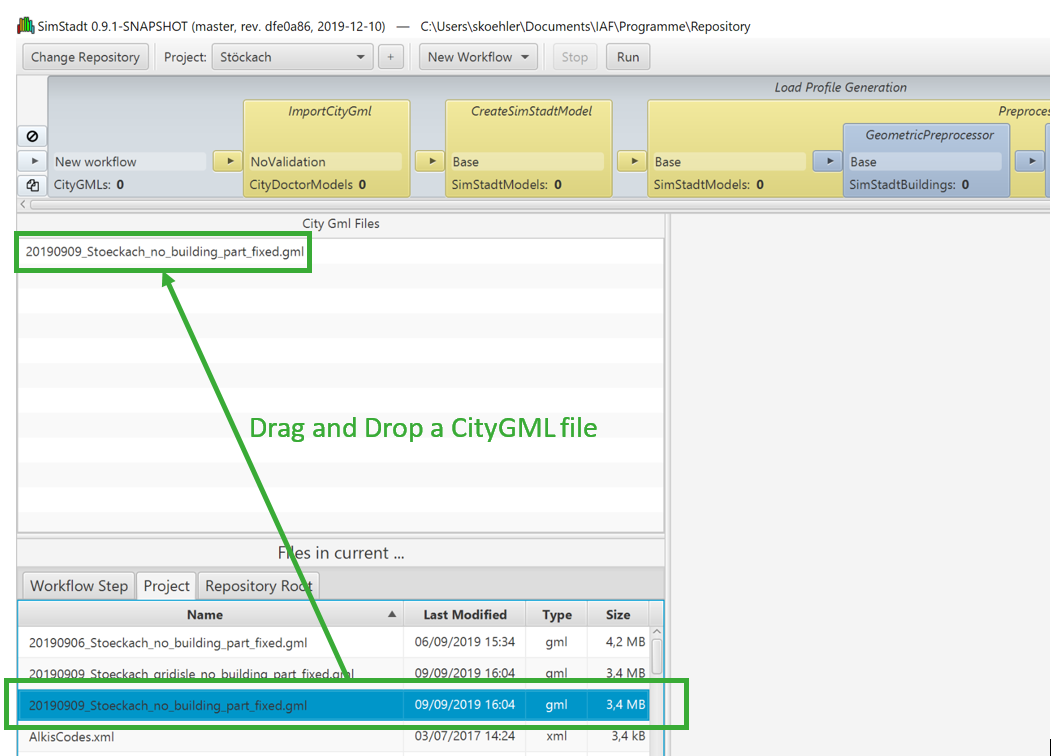
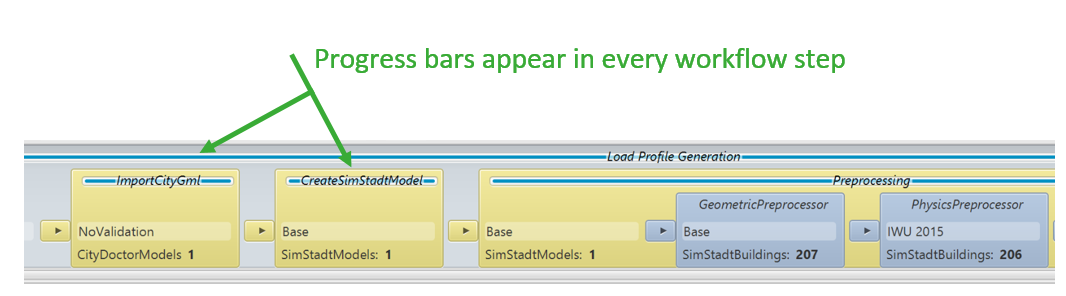
You are now ready to click the "Run" bottom in the menu bar. For the whole workflow and each workflow step progress bars will appear. The workflow has finished when the last progress bar has proceeded until the end.
6. View results
To view results you now click on either the workflow steps or workflow sub steps and the result window will display some results. There are several modes of visualization.
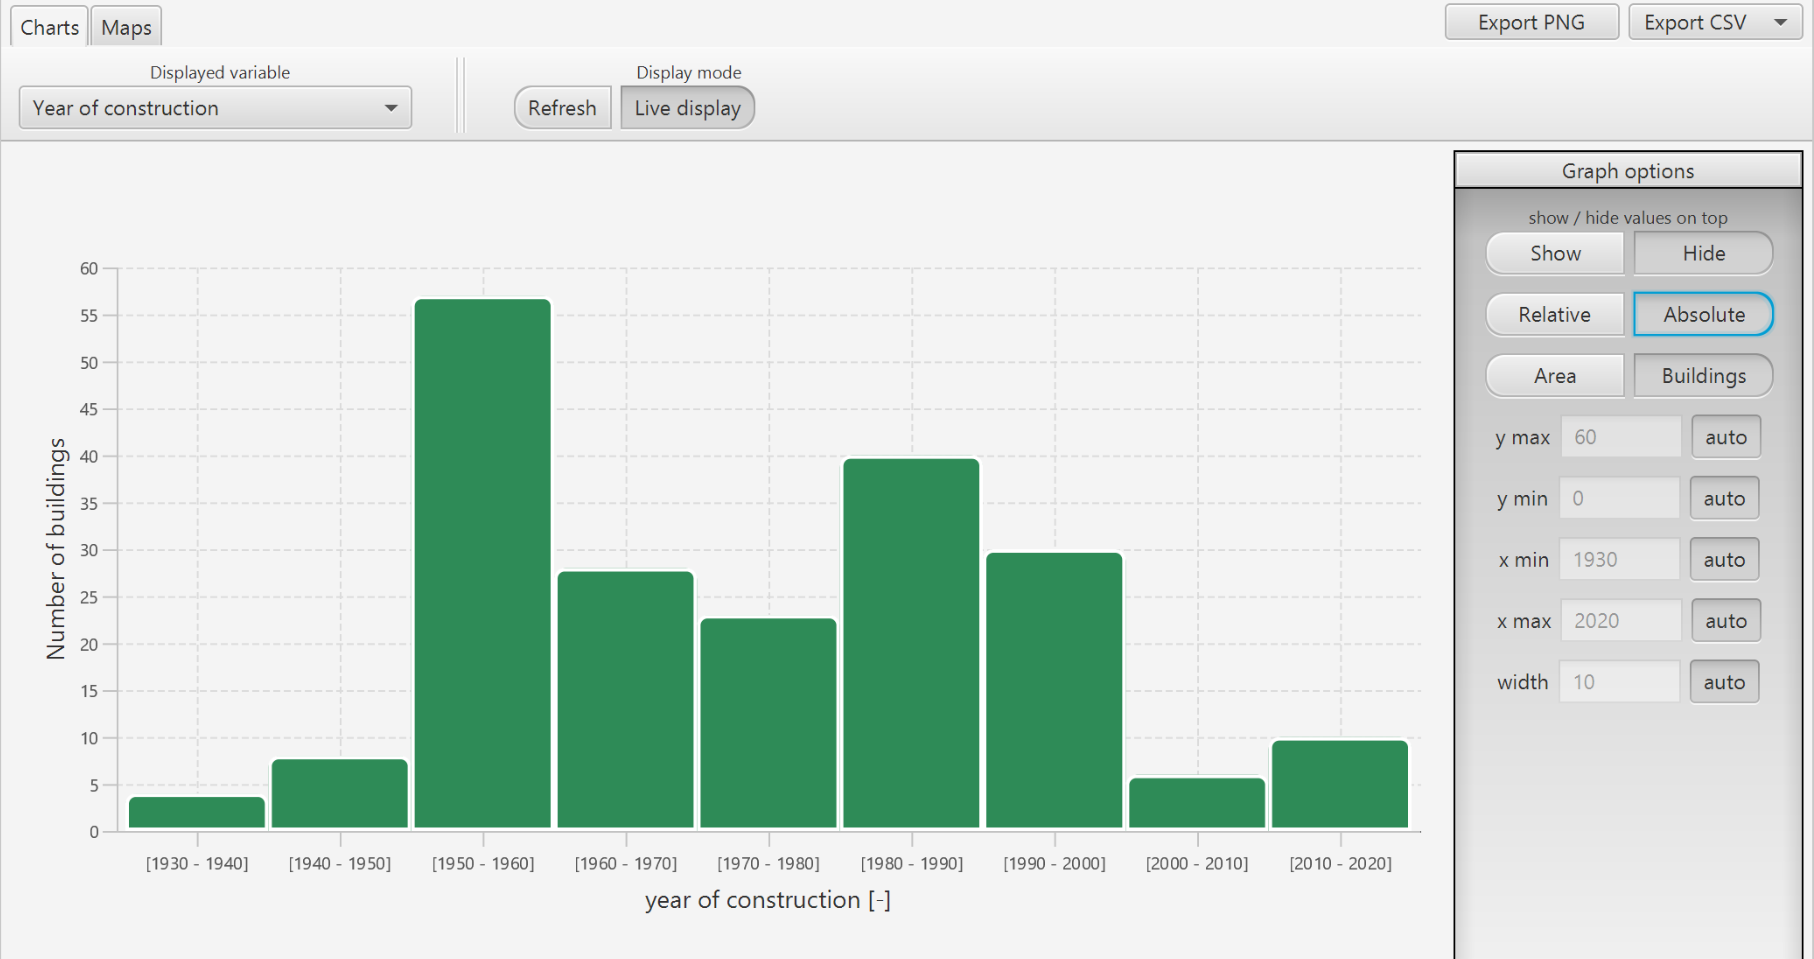
Charts: they present aggregated results for the CityGML file selected. Graph options enable to modify the axis scale and resolutions, to switch from relative to absolute value, to present the values per building number or per building floor area etc. During the simulation run, results may be displayed by selecting the display mode "Live display".
Maps: different maps types are available, depending on the purpose you need it for. ("Urban raster", "Building view" or "Density Map"). For instance, "Urban raster" enables to display anonymous data aggregated at a given resolution (Cell side), while "Building view" displays variables calculated for each building, respectively building surface. "Density Map" is particularly useful to observe the concentration of energy demands for instance.
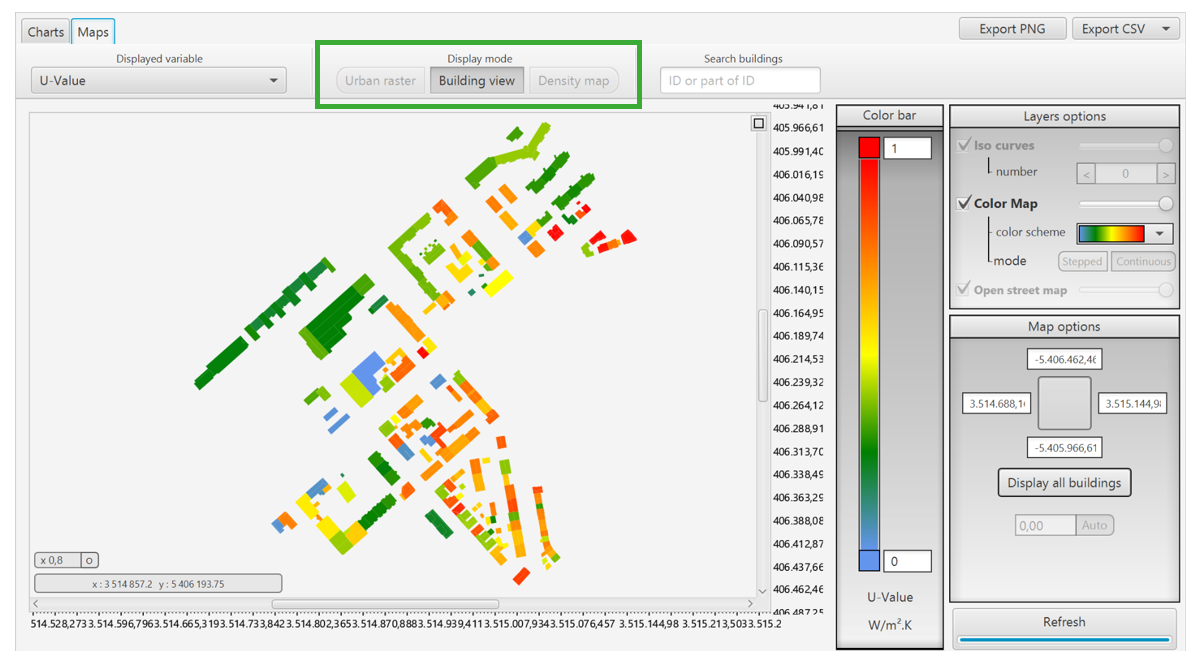
For each of these map types, a color bar may be selected (Color Map > color scheme). Only for the Density map, iso-curves may be additionally selected, with different coloring mode (stepped / continuous) in the Layers options. After each layer/map option change, the button refresh may be activated.
To work further with the results you may look at the CSV-files generated for the workflow step. For this you click on the last workflow step displayed in the workflow window and choose the workflow step tab in the explorer window.
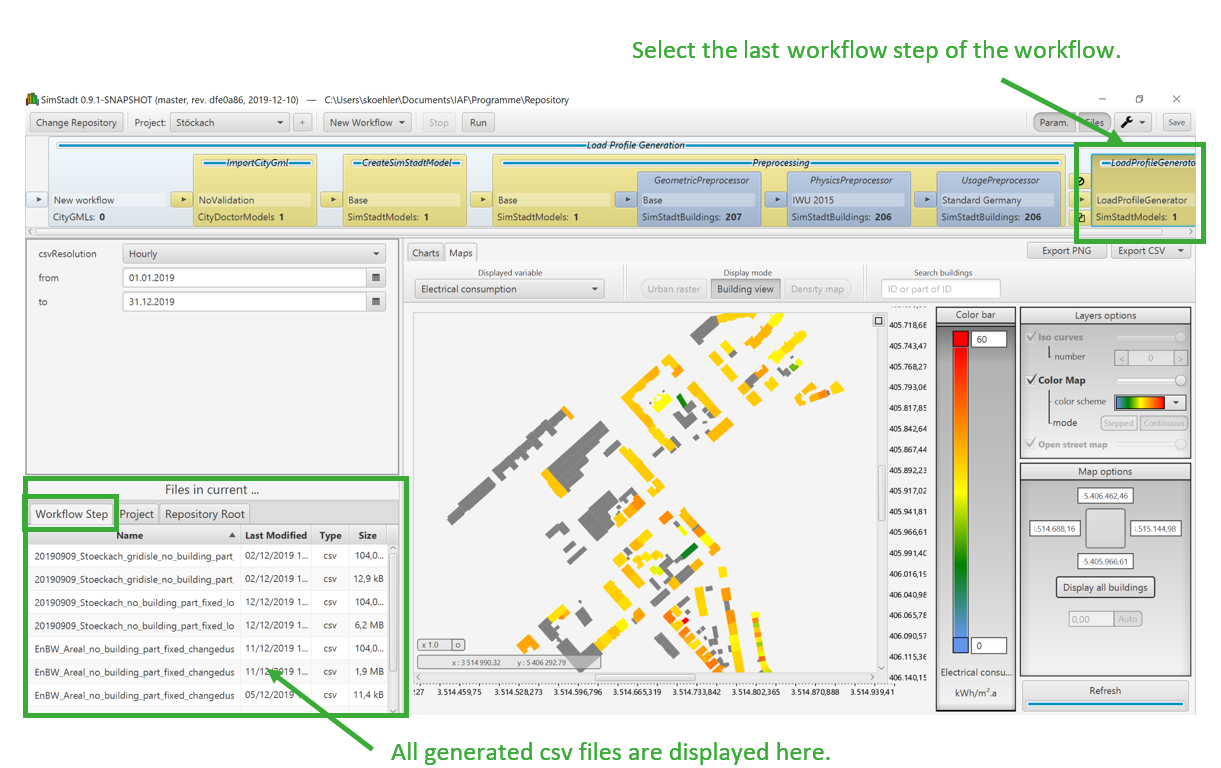
You can now double click on one CSV file to view the results. With a right mouse click you have the option to copy, delete or rename the CSV file. You also look up the path where SimStadt has saved the results with the option " open containing folder". SimStadt saves this data automatically for every run!
Congratulations, you now have successfully used SimStadt for the first time.