SimStadt Documentation
SimStadt
SimStadt is the name of an urban simulation environment developed at HFT Stuttgart and of a project of the same name, which in turn is the continuation of a project completed in 2015 (SimStadt). The final report of SimStadt 2.0 is available in German here.
SimStadt, in its current stage of development, is able to use data of a real urban planning situation or planning state for energy analyses of buildings, city quarters, whole cities and even regions. The application scenarios range from high-resolution simulations of building heating requirements and potential studies for photovoltaics to the simulation of building refurbishment and renewable energy supply scenarios. Thus SimStadt is able to accompany e.g. architects, engineering offices, urban planners and municipalities substantially in integrated planning processes and for the definition of measures towards a sustainable (re)design of buildings and quarters.
SimStadt v2 has been released, and is available here!
Getting started ↵
Install software
Required
Java 17+
Java version 17 64-bit should be installed on the system, either as JDK or JRE, with JavaFX libraries. Java 21 should be fine too.
Liberica JDK is known to work well for SimStadt:
Liberica JDK — а free, supported and 100% open-source binary distribution
- If you want to use SimStadt : you can download the Full JRE. (mirror)
- If you want to write Java code and use it in SimStadt : you can download the Full JDK. (mirror)
Installations for macOS or Linux are available here, for example:
- https://download.bell-sw.com/java/17.0.14+10/bellsoft-jre17.0.14+10-linux-amd64-full.deb for Linux
- https://download.bell-sw.com/java/17.0.14+10/bellsoft-jre17.0.14+10-macos-aarch64-full.dmg for macOS
Oracle JDK
Oracle Java SE license has changed, and OpenJDK versions should be preferred.
Error: Could not find or load main class eu.simstadt.desktop.SimStadtApp
If SimStadt does not start and outputs Error: Could not find or load main class eu.simstadt.desktop.SimStadtApp, it might mean that a library is missing. For example, the openjdk-17-jre.deb Ubuntu package does not contain JavaFX libraries. Liberica JDK should be installed instead.
INSEL
INSEL 8 : Software for simulation, monitoring, and visualization of energy systems
INSEL is used as the engine for multiple workflow steps, and should be installed before SimStadt is started.
INSEL is now freeware, and can be downloaded:
- For Windows, Install Insel V8.3.1.0b.exe.
- For Ubuntu 20.04 and newer, insel_8.3.1.0b_x64_full.deb.
SimStadt v2
A new data model is actively in development. Every existing workflow has been ported. Some bugs are still expected, though.
There are new features (green water workflow, more detailed load profile and a new shadowing algorithm), and the latest version is available at SimStadt v2.
This zip file can be extracted anywhere you want, and contains executables for Windows (SimStadt.bat), Linux (SimStadt.sh) and macOS (SimStadt.command).
Recommended
Test Repository
SimStadt workflows need CityGML files as input, distributed in project folders inside a repository.
- Here is an example repository, with some predefined projects and CityGML files (e.g. for HfT Stuttgart campus, NYC or Rotterdam).
- You can extract this zip folder anywhere you want.
- The first time you start SimStadt, you can select a location pointing at this repository.
Gnuplot
Gnuplot is a portable, multi-platform, command-line driven graphing utility
Gnuplot is used by some workflowsteps (e.g. Visualization) for visualization purposes.
It can be downloaded here. (mirror)
Optional
SimStadt v1
SimStadt v1 isn't developed anymore, but the program is still available here.
FZK Viewer
FZKViewer is a software tool for the visualization of semantic data models from the fields of BIM (Building Information Modeling) and GIS (Geographic Information Systems). The focus here is on open standardized data formats.
FZKViewer is developed by KIT and is a useful tool in order to visualize or check CityGML files. It can be downloaded here. (mirror)
Simplified Radiosity Algorithm
Simplified Radiosity Algorithm is required by IrradianceProcessor for shadow calculations.
- Download SimplifiedRadiosity.zip.
- Extract to
C:\Program Files\, so thatC:\Program Files\SimplifiedRadiosity\shortwave_integer.exeis an executable. - SRA executable should then be found by IrradianceProcessor when SRA_Perez is selected.
First Run
This documentation helps you to do a first run with the SimStadt application and explains the basics of the graphical user interface (GUI).
1. Launch SimStadt
After all required programs (Java 17, INSEL, SimStadt.zip, etc.) are installed on your computer, open the unzipped SimStadt folder (normally named "SimStadt_0.10.0-SNAPSHOT_xxxxxx"). This should look like this:
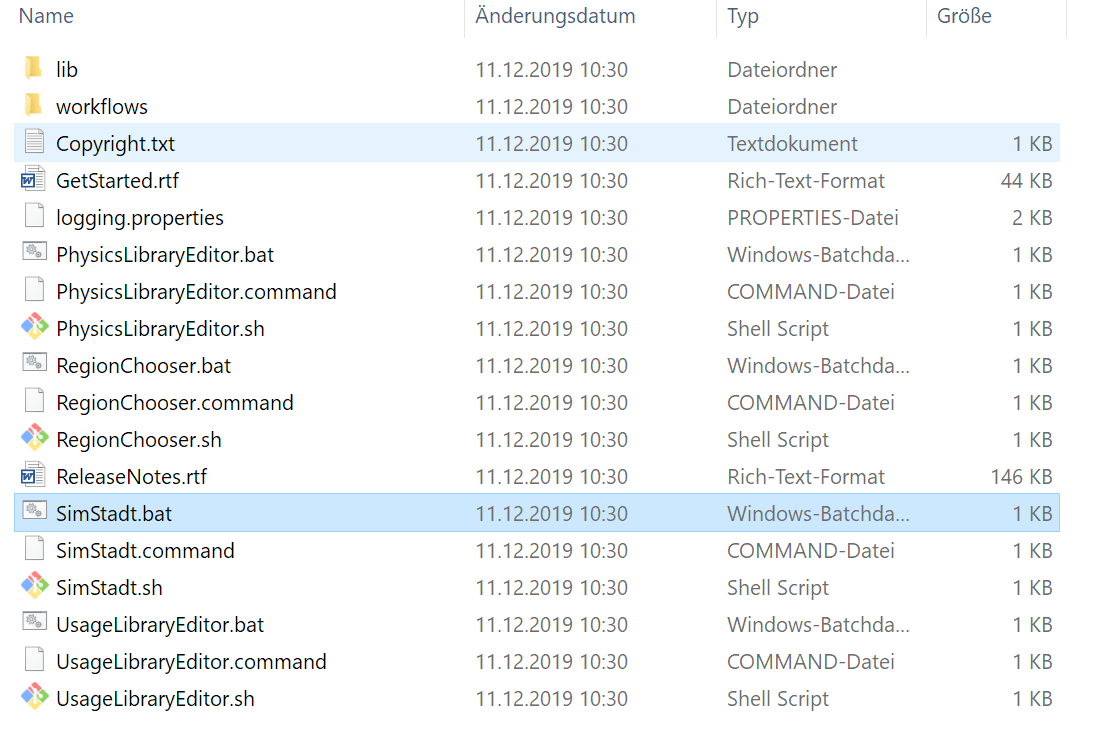
To start SimStadt on Windows you double click on: "SimStadt.bat". Linux users please use the "SimStadt.sh", macOS users double click on "SimStadt.command". RegionChooser, PhysicsLibraryEditor and UsageLibraryEditor are also available.
2. User interface
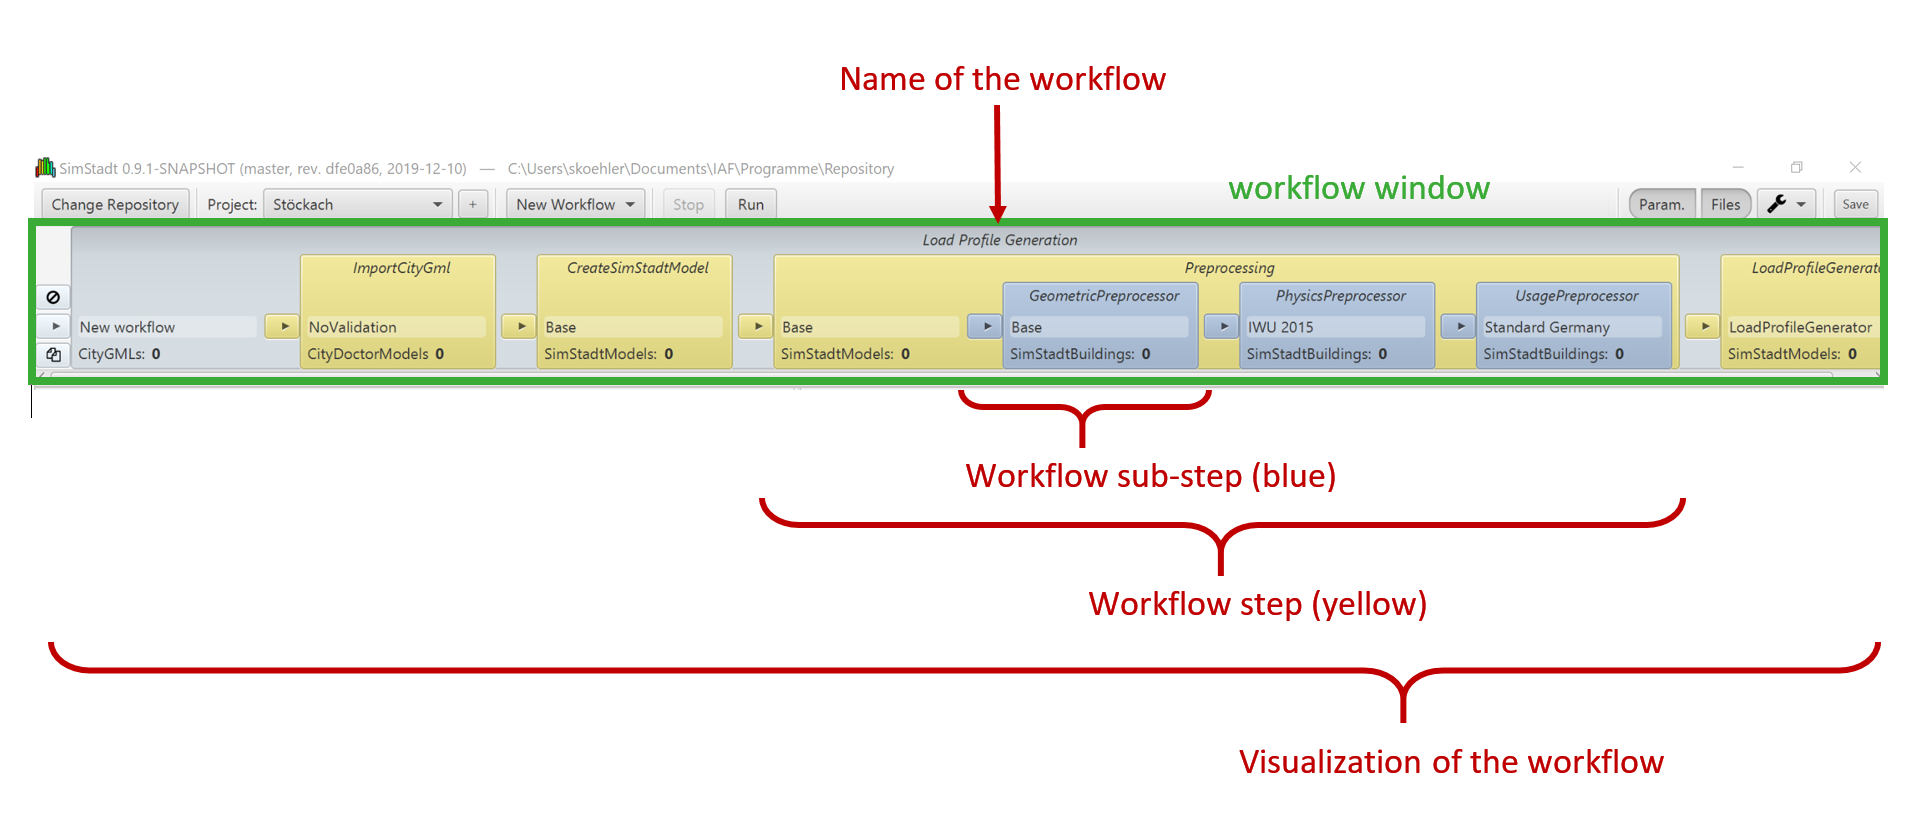
When opening SimStadt you see the following GUI (Graphical User Interface) with the menu bar and three subwindows.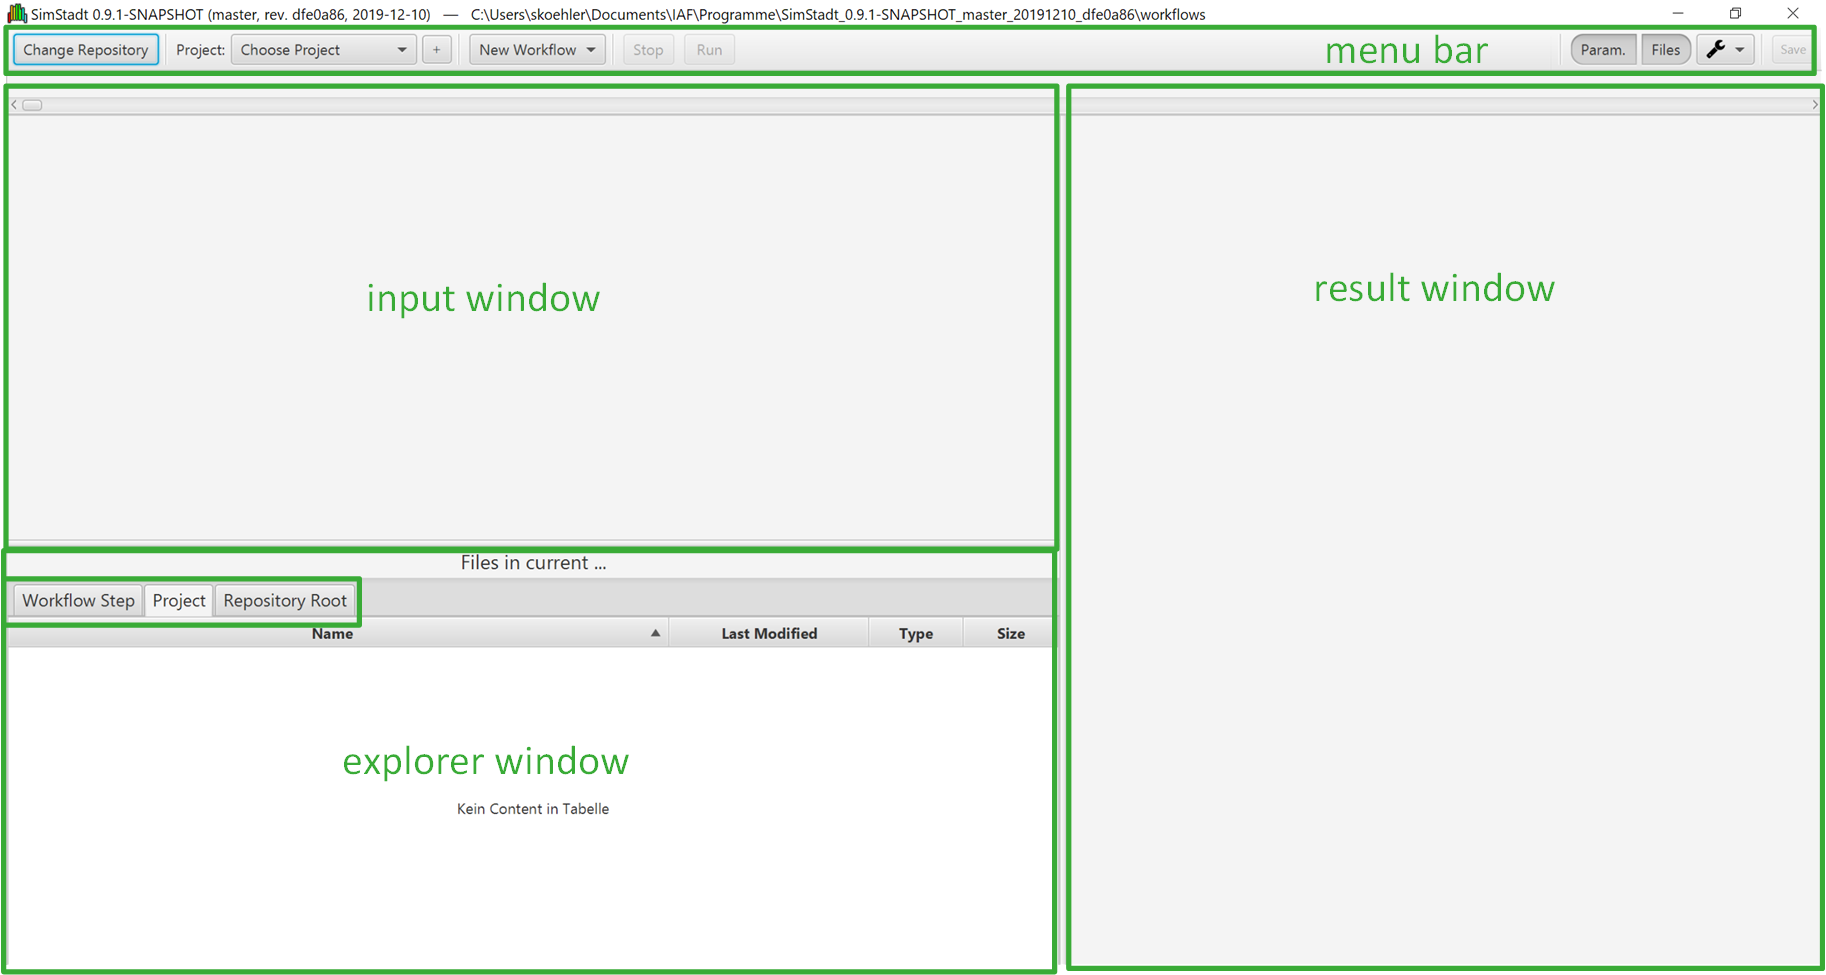
In the menu bar you choose :
- the location of your repository
- One of the projects, located inside the repository.
- The type of workflow.
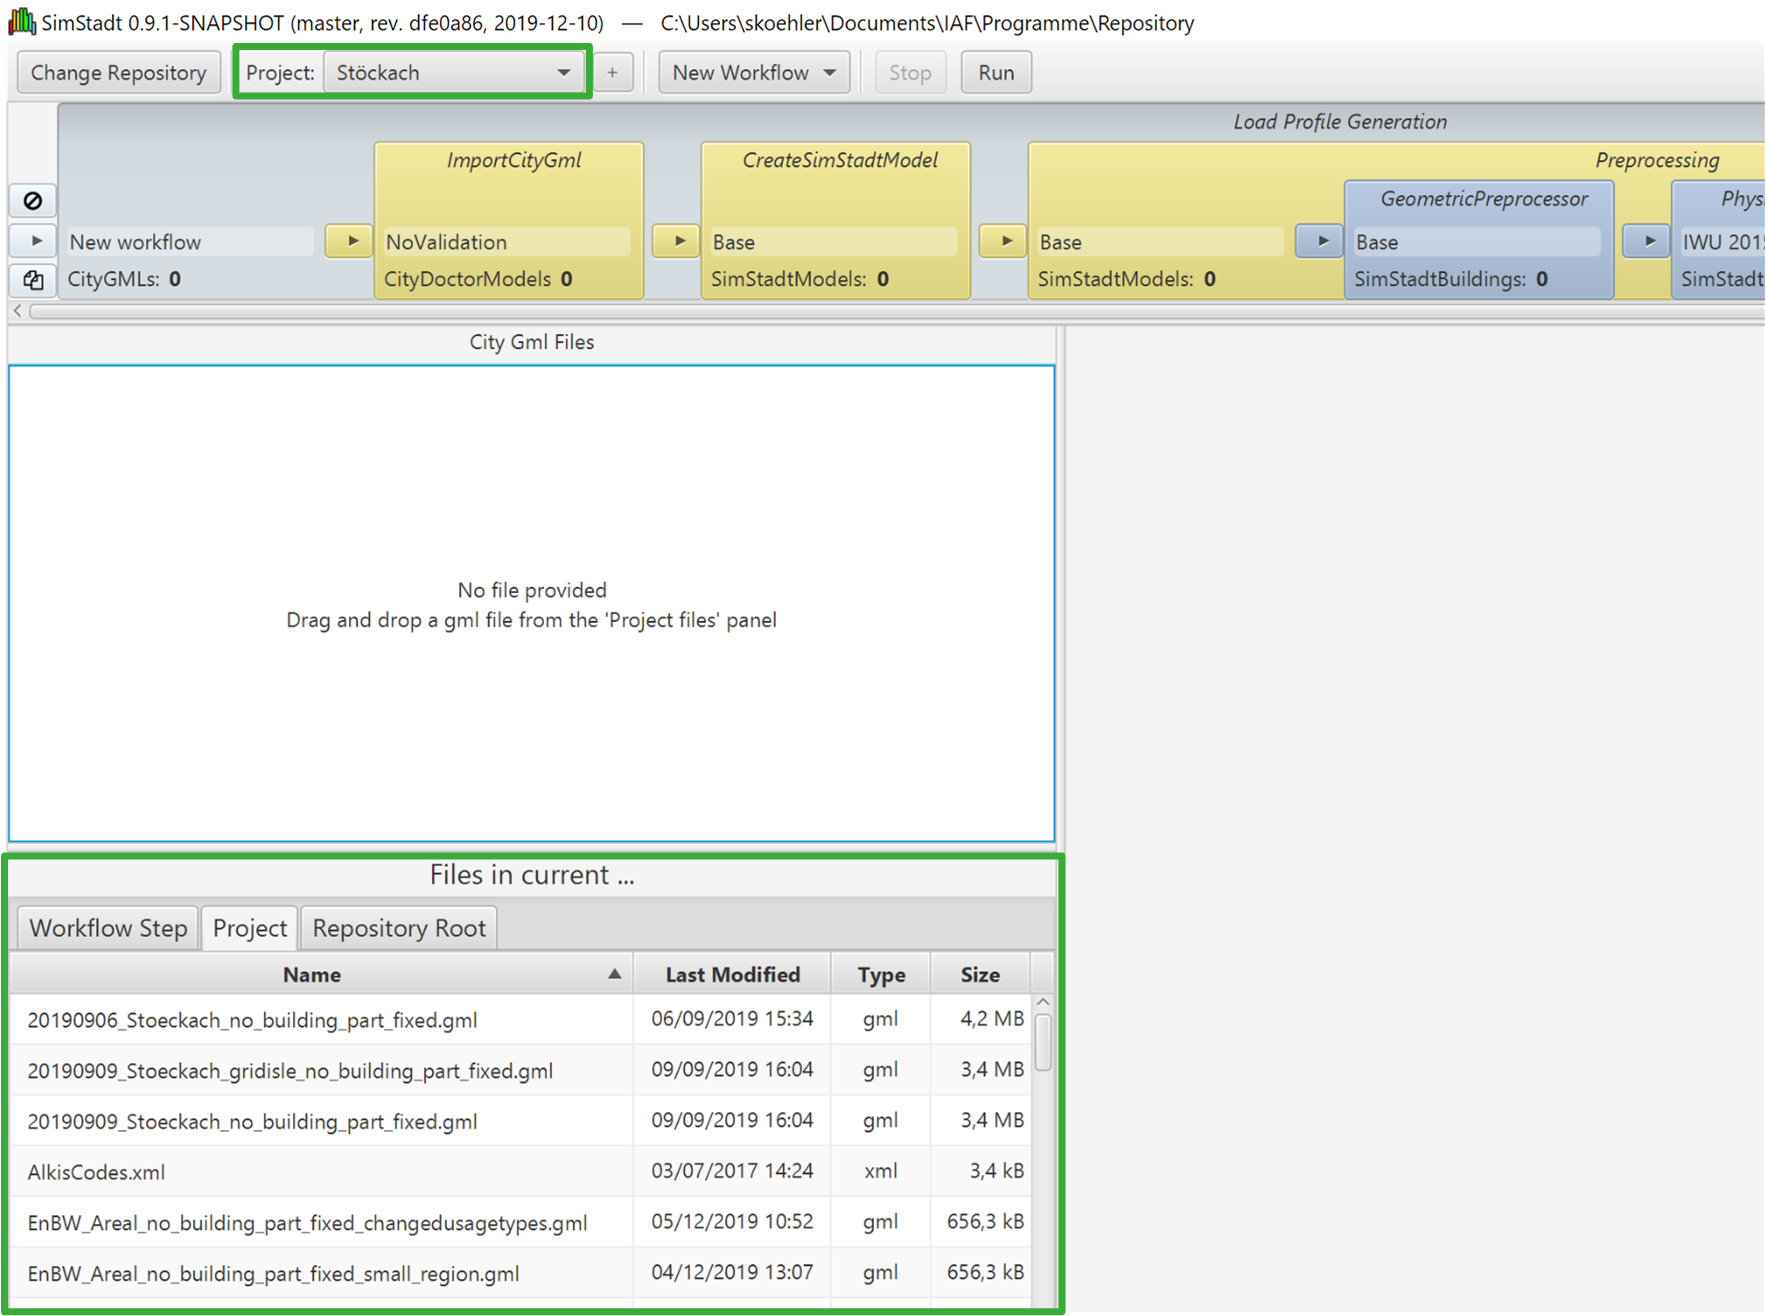
The upper left window is the input/parameter window for CityGML files. CityGML files are the basic input for the SimStadt application. They contain information about the geography, the geometry and the attributes of buildings.
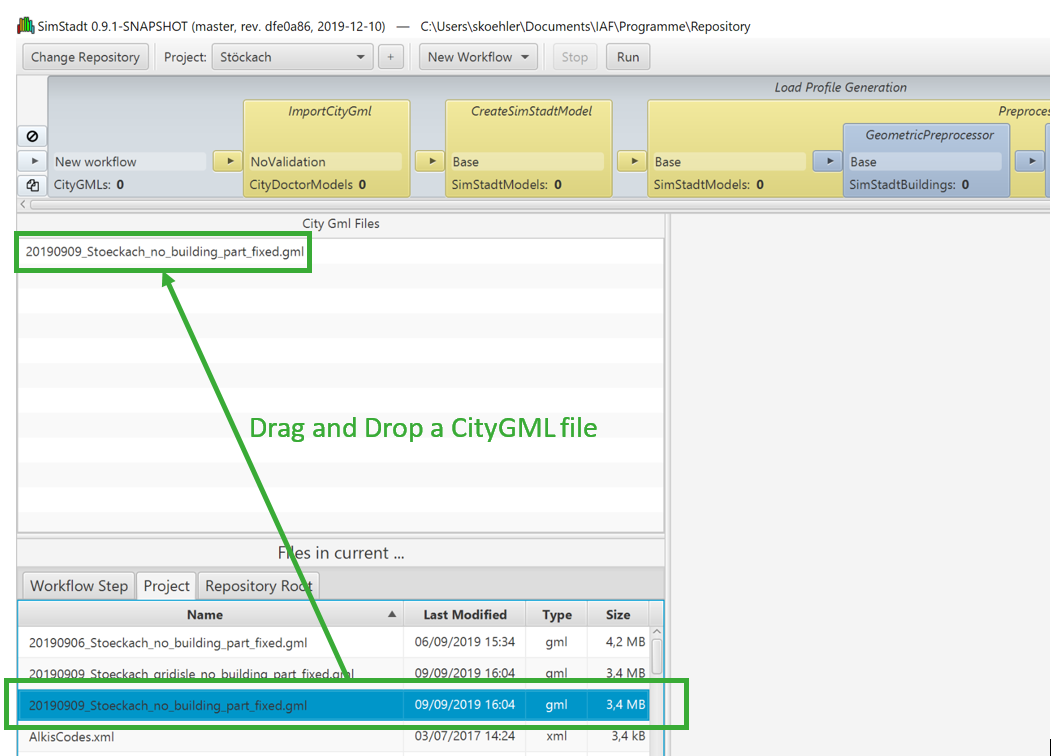
The bottom left window works as a sort of explorer window/file viewer, with three tabs.
-
The "Workflow Step" tab will contain all the created output files, after a simulation run.
-
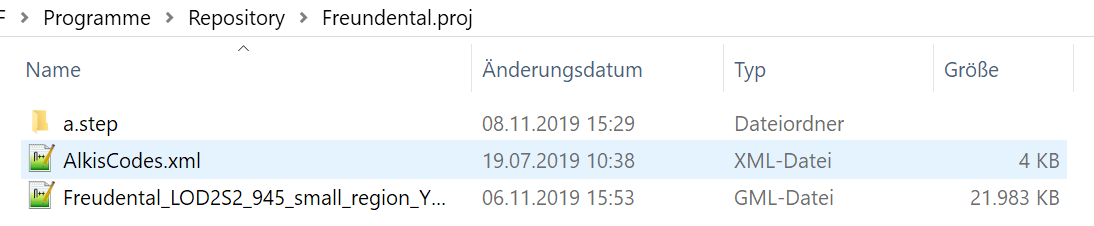
In the "Project" tab you will find all files that are saved in your SimStadt project folder. Usually the project folder contains different CityGML files and sometimes a ALKIS translation file in .xml format and a weather file in .tmy3 format.
-
"Repository Root" with files common to every project.
The large right hand side window will graphically display the results either as chart or as 2D Map.
3. Choose a repository
Before you can run SimStadt you have to choose a path where your repository is found. For a start, you can use a test repository. When you open the folder in your explorer you will find different projects named xxx.proj.
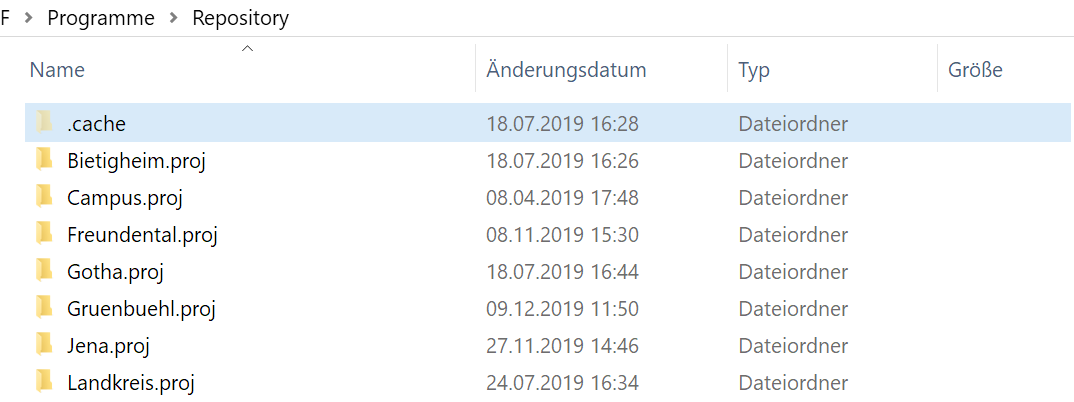
The project folder contains CityGML files and - if necessary- a ALKIS translation file in .xml format and a weather file in .tmy3 format. A CityGML file can be extracted with RegionChooser.
To select the path to your repository click on the button "Change Repository" in the menu bar. You will be forwarded to your explorer. There you define the path to your repository and click "select folder".

4. Select a project and a workflow
After you have chosen the location of your repository, you select a project by clicking on the drop down bottom. Here you should see all your projects listed that your repository folder contains.
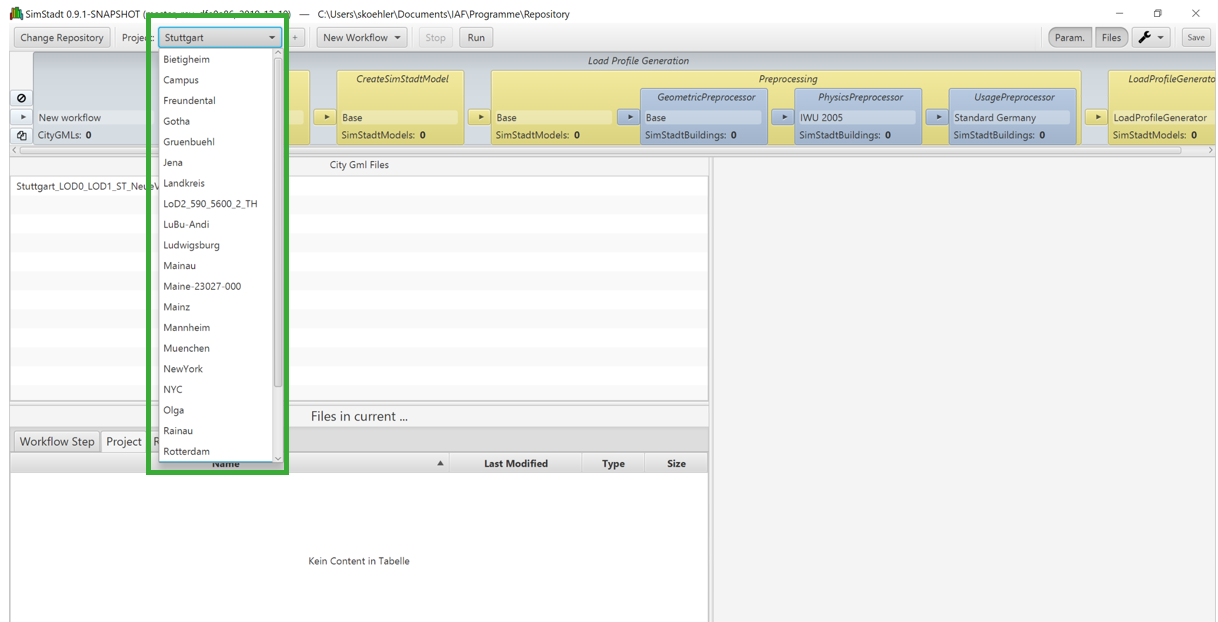
By clicking on a project name you select the project. The tab "Project" in the explorer window should now display all the files that are in the specific project folder. You will not see any projects or files if the connection to your repository is not correctly established.
After picking a project, you select a workflow also by clicking on the drop down arrow, where all the available workflows are listed.
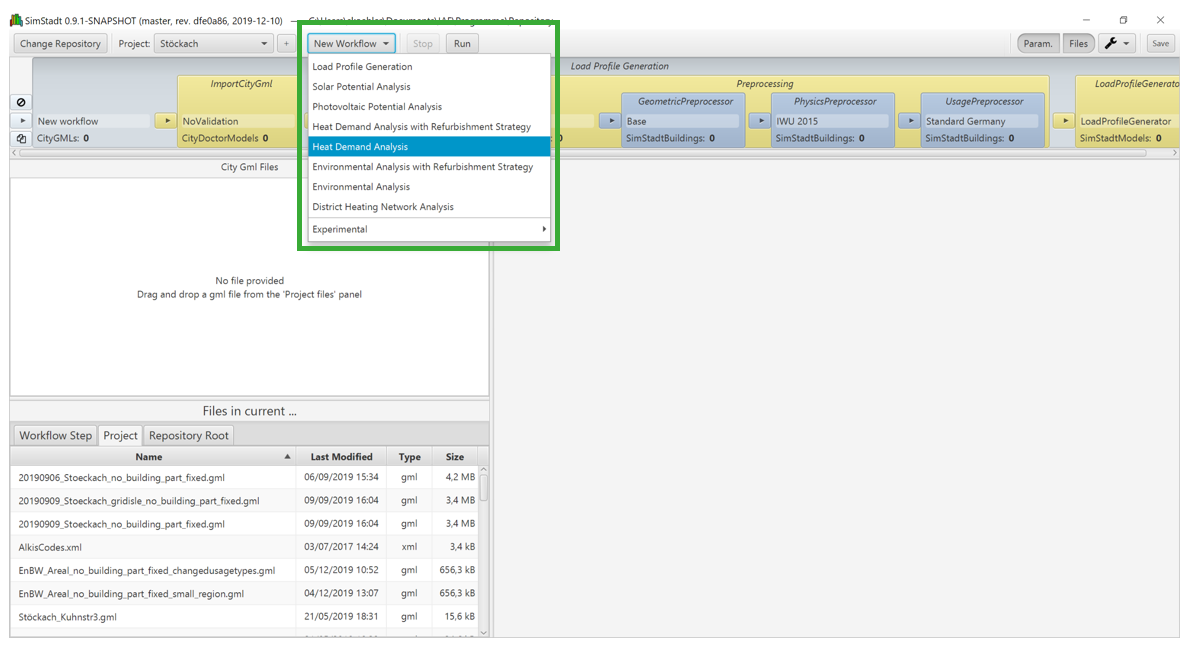
The chosen workflow should be displayed in a new window between the menu bar and the other windows. This window is called the workflow window. The workflow window contains all the workflow steps and workflow sub-steps that are required to run a workflow.
You might have noticed that also your GUI has extended with another window, the workflow window during this process.
5. First Run
To successfully run SimStadt now you only drag and drop a CityGML file from the "Project" tab of the explorer window into the input window. The input window should display the chosen file.
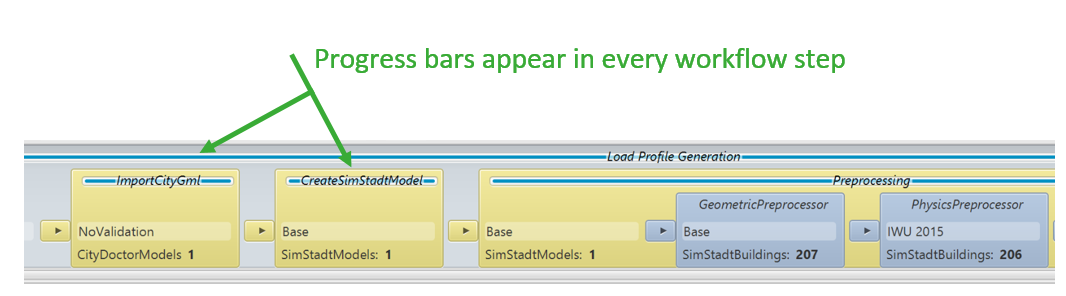
You are now ready to click the "Run" bottom in the menu bar. For the whole workflow and each workflow step progress bars will appear. The workflow has finished when the last progress bar has proceeded until the end.
6. View results
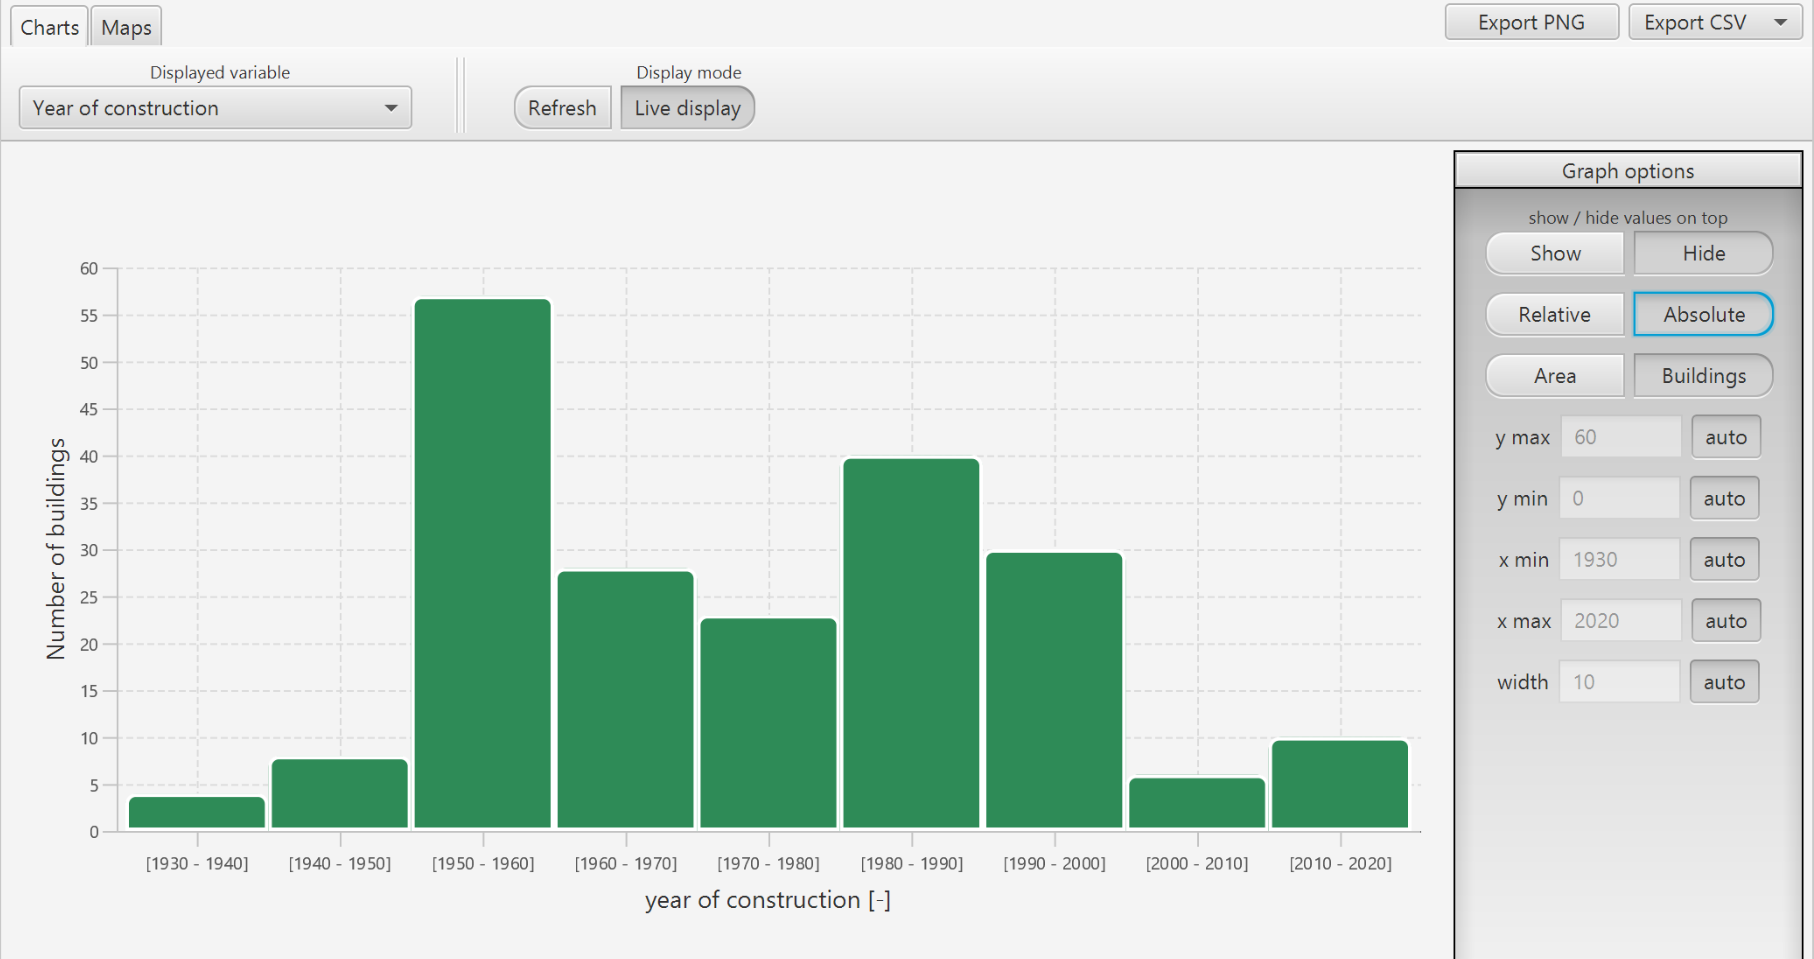
To view results you now click on either the workflow steps or workflow sub steps and the result window will display some results. There are several modes of visualization.
Charts: they present aggregated results for the CityGML file selected. Graph options enable to modify the axis scale and resolutions, to switch from relative to absolute value, to present the values per building number or per building floor area etc. During the simulation run, results may be displayed by selecting the display mode "Live display".
Maps: different maps types are available, depending on the purpose you need it for. ("Urban raster", "Building view" or "Density Map"). For instance, "Urban raster" enables to display anonymous data aggregated at a given resolution (Cell side), while "Building view" displays variables calculated for each building, respectively building surface. "Density Map" is particularly useful to observe the concentration of energy demands for instance.
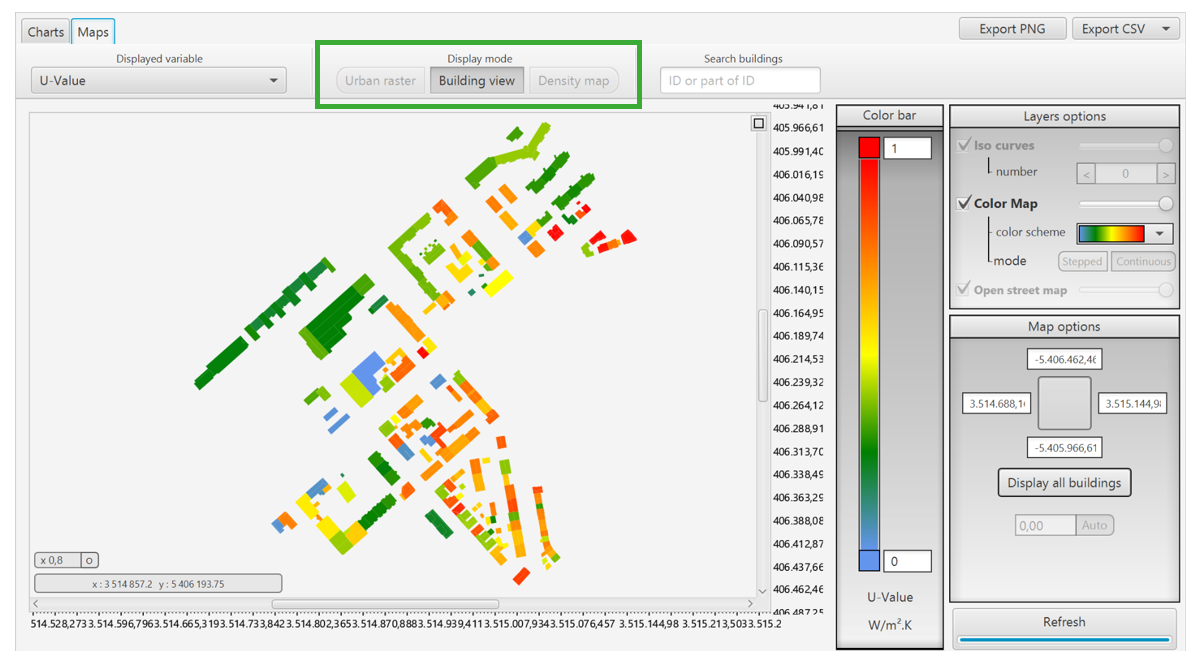
For each of these map types, a color bar may be selected (Color Map > color scheme). Only for the Density map, iso-curves may be additionally selected, with different coloring mode (stepped / continuous) in the Layers options. After each layer/map option change, the button refresh may be activated.
To work further with the results you may look at the CSV-files generated for the workflow step. For this you click on the last workflow step displayed in the workflow window and choose the workflow step tab in the explorer window.
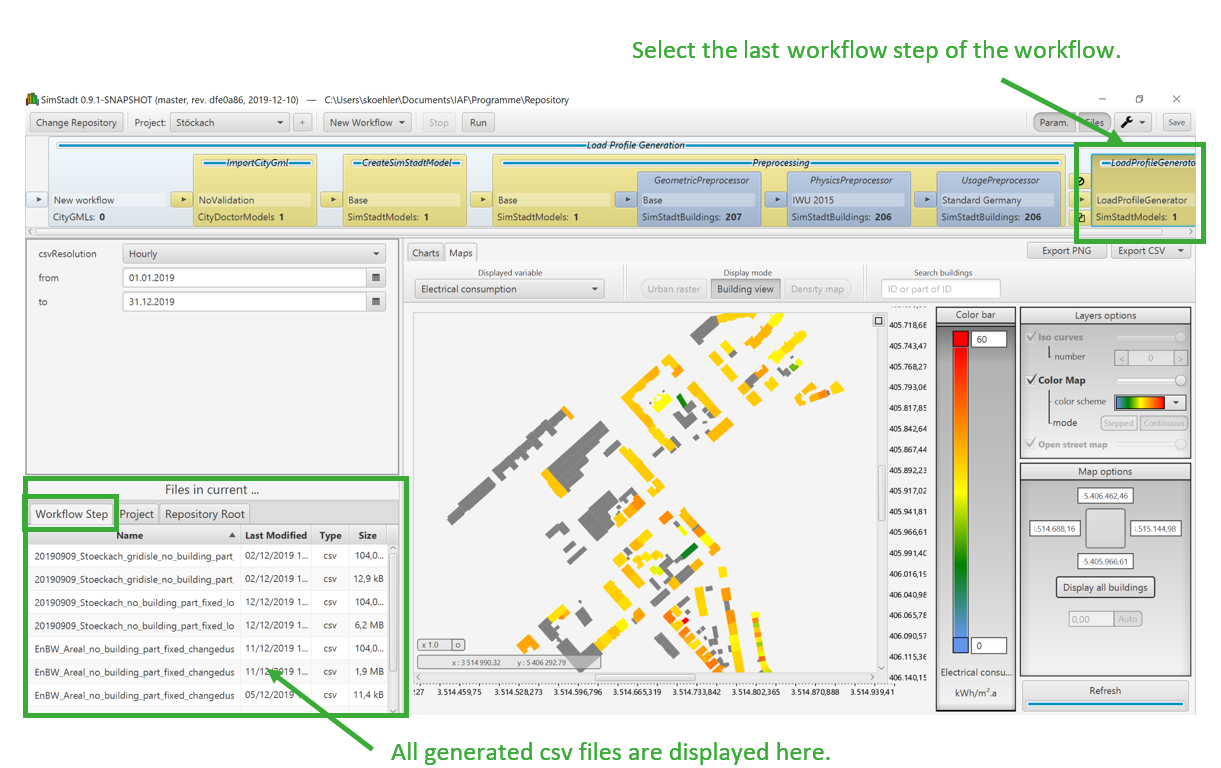
You can now double click on one CSV file to view the results. With a right mouse click you have the option to copy, delete or rename the CSV file. You also look up the path where SimStadt has saved the results with the option " open containing folder". SimStadt saves this data automatically for every run!
Congratulations, you now have successfully used SimStadt for the first time.
Screencast
Repository Structure
Repository
A repository in SimStadt is the root folder in which you collect and save all your projects and CityGML files.
An example repository can be downloaded here.
It contains all your models, your simulation parameters and the results. Those files are usually distributed in separate projects:
You will have to select a repository folder the first time you launch SimStadt.
You can select another folder by clicking on Change Repository in the GUI:
Project
A project is a sub-folder inside a repository.
The folder name must end with .proj, e.g. Stuttgart.proj or NYC-Manhattan.proj.
It contains CityGML files. You are free to distribute the 3D models in as many projects as you wish.
Workflows will also be saved by SimStadt in the project folder.
You can select a project in the GUI:
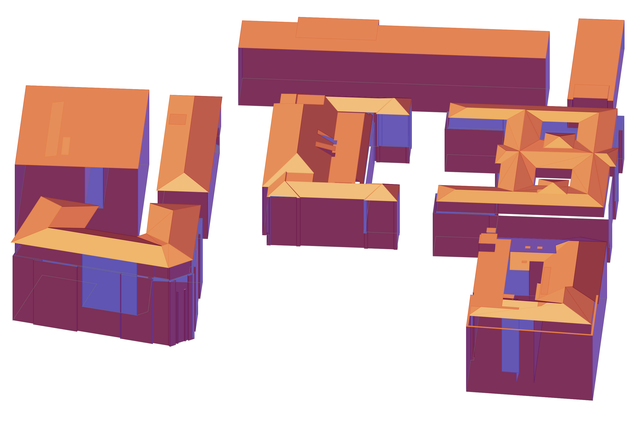
CityGML
CityGML is an open standardised data model and exchange format to store digital 3D models of cities and landscapes. It defines ways to describe most of the common 3D features and objects found in cities (such as buildings, roads, rivers, bridges, vegetation and city furniture) and the relationships between them.
SimStadt needs a CityGML file as an input for every workflow. CityGML are expected to end with .gml extension. Internally, they are written in XML.
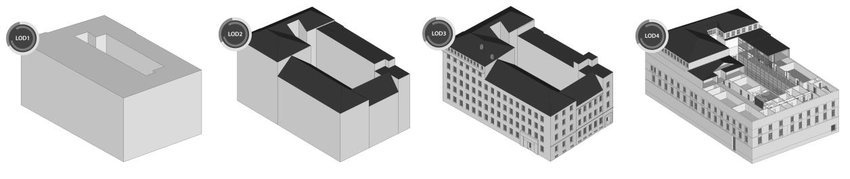
Level of Detail
The CityGML file should have either :
- Level of Detail 1 (LOD1, extruded 3D geometry, with flat roofs)
- Level of Detail 2 (LOD2, 3D geometry with detailed roof shape)
Coordinate Reference System
The CityGML file should be georeferenced with a valid coordinate reference system, e.g. EPSG:32632 or EPSG:31467.
The coordinate reference system (CRS) is usually specified in the header of the CityGML file, or for each building:
<gml:boundedBy>
    <gml:Envelope srsName="EPSG:25832" srsDimension="3">
        <gml:lowerCorner>512665.134 5403112.331 254.0</gml:lowerCorner>
        <gml:upperCorner>512698.044 5403161.657 265.315</gml:upperCorner>
    </gml:Envelope>
</gml:boundedBy>
SimStadt uses this information in order to convert the local coordinates into latitude and longitude, for example for WeatherProcessor.
Workflow
The goal of a workflow is to define a complete simulation from start (a CityGML file) to finish (results files, diagrams or a modified CityGML file).
A workflow is a sequence of workflowsteps.
Examples of workflows are:
- Heat Demand Analysis, which estimates the current heat demand of buildings.
- Photovoltaic Potential Analysis, which estimates how many photovoltaic panels could be installed on the roofs, and how much yield they would produce on average per year.
Workflows are saved in ***.step folders inside the project folders.
Workflowstep
A workflowstep is a single unit of simulation, with one specific goal, e.g.:
- importing a CityGML file.
- getting weather data for the location
- or calculating the heat demand of the buildings.
Workflowsteps are typically chained together in order to form a workflow.
Workflowsteps are written in Java, like the rest of the SimStadt structure.
It is possible to write new workflowsteps in Java, even without having access to the complete SimStadt sourcecode.
Accessing workflowstep folder directly
Workflowsteps are saved in nested ***.step folders inside the workflow folder. This structure can lead to very long paths, (e.g. TestRepository\Test.proj\b.step\a.step\a.step\a.step\a.step\a.step\a.step). In order to avoid clicking many times in the Explorer in order to access the desired folder, you can select the desired workflowstep in the GUI, and then right-click on Workflow Step tab and selecting Open containing folder.
Cache
Some calculations (e.g. IrradianceProcessor) can take a long time to run. In order to speed up the next calculations done on the same CityGML file, results are stored in cache.
It is a hidden .cache folder inside the repository (e.g. TestRepositoryWithCache\.cache), containing information about weather, irradiance or street layout.
It can be deleted without concern, but the next simulations might take longer than usual.
There are also project specific cache folders (e.g. TestRepository\Gruenbuehl.proj\.cache), for shadow calculations with SRA_Perez.
Most common problems
Missing weather data on PVGIS server
SimStadt: 0.10.0-SNAPSHOT (master, rev. 6d7c707, 20230828)

java.io.UncheckedIOException: java.io.FileNotFoundException: https://re.jrc.ec.europa.eu/api/v5_1/MRcalc?lat=49.98975&lon=8.45495&horirrad=1&avtemp=1&outputformat=csv
PVGIS has been updated in September 2024, and doesn't offer data for v5.1 anymore. Old versions of SimStadt try to download data from PVGIS over the old API, and the server doesn't return any data.
SimStadt has been updated to use the new 5.3 API. You can download the last version here.
Wrong Java version (SimStadt v2)
Launching: java -classpath lib/*;workflows/* -Xms512m -Xmx2g -Dfile.encoding=UTF-8 -Dlogback.configurationFile=./logging_configuration.xml eu.simstadt.desktop.SimStadtApp
Error: A JNI error has occurred, please check your installation and try again
Exception in thread "main" java.lang.UnsupportedClassVersionError: eu/simstadt/desktop/SimStadtApp has been compiled by a more recent version of the Java Runtime (class file version 61.0), this version of the Java Runtime only recognizes class file versions up to 52.0
SimStadt v2 requires Java 17, as of 2025-02-25.
Wrong Java version (SimStadt v1)
Launching: java -d64 -classpath lib/*:workflows/* -Xms512m -Xmx2g -Djava.util.logging.config.file=logging.properties eu.simstadt.desktop.SimStadtApp
Unrecognized option: -d64
Error: Could not create the Java Virtual Machine.
Error: A fatal exception has occurred. Program will exit.
SimStadt v1 requires Java 8.
SimStadt v2 has been ported to Java 17. See here.
Missing JavaFX
Launching: java -d64 -classpath lib/*:workflows/* -Xms512m -Xmx2g -Djava.util.logging.config.file=logging.properties eu.simstadt.desktop.SimStadtApp
Error: Could not find or load main class eu.simstadt.desktop.SimStadtApp
SimStadt requires JavaFX libraries. See here.
32-bit Java
Error: This Java instance does not support a 64-bit JVM.
This error message means that the installed Java version is 32-bit, but SimStadt requires 64-bit Java. See here.
Negative thermal boundary area above ground
======================== Summary ========================

Excluded 2 buildings from processing (reason: Negative thermal boundary area above ground.)


================ Excluded buildings lists ===============

Excluded 2 buildings from processing (reason: Negative thermal boundary area above ground.)

# GML ID [-];Volume [m3];Footprint area [m2];X [m];Y [m];Original ID
_Oberstadt4736_BD.3hed4aOE5j7UIYdXDgpD;2941.75;591.29;447818.78700;5536496.37450;-
_Oberstadt4736_BD.wX8nkPR3sRSdqyVQfXHW;976.95;231.12;447725.63500;5536501.52650;-
This error was due to a buggy implementation in older versions. Many buildings were discarded from the simulation.
Updating to a newer version (September 2020) should help solve the problem.
Envelope missing
SimStadt: development version (2020-12-15)

java.lang.UnsupportedOperationException: Envelope missing in City GML model or it has no SRS name!
    at eu.simstadt.geo.GeoCoordinatesAccessor.<init>(GeoCoordinatesAccessor.java:124)
    at eu.simstadt.geo.GeoCoordinatesAccessor.coordinatesComputedFromBuildingsIfNeeded(GeoCoordinatesAccessor.java:68)
    at eu.simstadt.datamodel.SimStadtModel.coordinatesComputedFromBuildingsIfNeeded(SimStadtModel.java:82)
...
The coordinate reference system should be defined at the beginning of the CityGML file. For example:
<gml:boundedBy>
    <gml:Envelope srsName="EPSG:25832" srsDimension="3">
        <gml:lowerCorner>512665.134 5403112.331 254.0</gml:lowerCorner>
        <gml:upperCorner>512698.044 5403161.657 265.315</gml:upperCorner>
    </gml:Envelope>
</gml:boundedBy>
Unknown srsName format
SimStadt: development version (2020-12-15)

java.lang.IllegalArgumentException: Unknown srsName format: IncorrectCRS:1234567
    at eu.simstadt.geo.GeoUtils.crsFromSrsName(GeoUtils.java:94)
    at eu.simstadt.geo.GeoCoordinatesAccessor.<init>(GeoCoordinatesAccessor.java:97)
    at eu.simstadt.geo.GeoCoordinatesAccessor.coordinatesComputedFromBuildingsIfNeeded(GeoCoordinatesAccessor.java:55)
    at eu.simstadt.datamodel.SimStadtModel.coordinatesComputedFromBuildingsIfNeeded(SimStadtModel.java:82)
...
This error happens if the CityGML model contains an envelope, but with an incorrectly defined coordinate reference system.
The simplest format is "EPSG:" followed by a valid id:
"ESPG:31467"for DHDN / 3-degree Gauss-Kruger zone 3"EPSG:32640"for WGS 84 / UTM zone 40N"EPSG:32118"for NAD83 / New York Long Island- ...
Incorrect EPSG id
Even if the envelope is correctly defined, with an existing coordinate reference system, the model might still not be correctly georeferenced.
For example, merely taking a German 3D model (e.g. with EPSG:31467) and replacing the EPSG id with ESPSG:32740 (UTM 40 S, for La Réunion) will not break the CityGML model. SimStadt will happily start the simulation, but with a 3D model located very far away from either Germany or La Réunion.
With some luck, some exception will occur (java.lang.IllegalArgumentException: Monthly weather values don't seem to be plausible for this location. Cannot generate hourly values.) so that at least it should be clear that there is a problem somewhere.
But if you have changed the EPSG id and the simulation completes without exception, it might be worth it to look at the log in the console, searching for suspicious information:
INFORMATION: Nearest weather station in INSELDB is 'Perth / Australia' (2421,4 km).
or
INFORMATION: Nearest weather station in INSELDB is 'Hami / China' (27,4 km).
In that case, the coordinates would need to be transformed too, according to the EPSG ids.
RegionChooser could be helpful for debugging.
Empty CSV file
If Heat Demand Analysis runs until the last workflowstep, it means that:
- the geometry is correct
- the model is georeferenced
- weather data has been found for this location.
Still, the output CSV file can be empty.
Missing year of construction
If the log file looks like:
======================== Summary ========================

Excluded 927 buildings from processing (reason: Missing year of construction)


================ Excluded buildings lists ===============

Excluded 927 buildings from processing (reason: Missing year of construction)

# GML ID [-];Volume [m3];Footprint area [m2];X [m];Y [m];Original ID
UUID_Building_733_689925_217494;50,80;16,93;340217,93641;7689037,27931;-
UUID_Building_767_561812_246917;302,66;100,89;340369,43699;7688845,44421;-
...
The buildings with missing "yearOfConstruction" are filtered out in Physics Preprocessor.
Make backups!
Feel free to modify the CityGML in a text editor, but please be sure to have backups of your data before you start.
A quick-and-dirty way to add a "yearOfConstruction" attribute to buildings (e.g. 2003) is to open the CityGML file in a text-editor, and replace all occurrences of:
<bldg:lod2Solid>
with
<bldg:yearOfConstruction>2003</bldg:yearOfConstruction><bldg:lod2Solid>
and
<bldg:lod1Solid>
with
<bldg:yearOfConstruction>2003</bldg:yearOfConstruction><bldg:lod1Solid>
Once done, every building inside the CityGML file should have a year of construction of 2003.
For more complex examples, inject_citygml_attributes.py or FME could be used.
Missing building function
If yearOfConstruction is defined for each building, Usage Preprocessor might still filters some building out if they do not have a building function (e.g. "residential" or "office"). See Usage Library Editor and AlkisCode.
======================== Summary ========================

Excluded 934 buildings from processing (reason: Missing building function)


================ Excluded buildings lists ===============

Excluded 934 buildings from processing (reason: Missing building function)

# GML ID [-];Volume [m3];Footprint area [m2];X [m];Y [m];Original ID
UUID_Building_236_9383_293477;182,55;60,85;340358,82959;7688757,69115;-
UUID_Building_79_855748_199796;2433,61;270,40;339737,98619;7688615,64091;-
...
It is possible to either define <bldg:function>1010</bldg:function> attribute in the CityGML file for the corresponding buildings, or simply select "Assume residential if unknown?" in Usage Preprocessor.
For more complex examples, inject_citygml_attributes.py or FME could be used.
Heat Demand Analysis should be able to complete the simulation with this information.
Unknown ALKIS code
Even if a building function (e.g. 31001_1000) is defined inside the CityGML model, it might be unknown to SimStadt or Usage Library Editor.
======================== Summary ========================


Excluded 1 buildings from processing (reason: Unknown ALKIS code: 31001_3000.)
Excluded 26 buildings from processing (reason: Unknown ALKIS code: 31001_2000.)
Excluded 5 buildings from processing (reason: Unknown ALKIS code: 31001_9998.)
Excluded 1 buildings from processing (reason: Unknown ALKIS code: 31001_3020.)
Excluded 46 buildings from processing (reason: Unknown ALKIS code: 31001_1000.)
Excluded 1 buildings from processing (reason: Unknown ALKIS code: 31001_3041.)


================ Excluded buildings lists ===============

Excluded 1 buildings from processing (reason: Unknown ALKIS code: 31001_3000.)

# GML ID [-];Volume [m3];Footprint area [m2];X [m];Y [m];Original ID
DEBY_LOD2_604881;2267.58;220.78;568080.14250;5517134.97850;-


Excluded 26 buildings from processing (reason: Unknown ALKIS code: 31001_2000.)

# GML ID [-];Volume [m3];Footprint area [m2];X [m];Y [m];Original ID
DEBY_LOD2_605705;19.69;9.19;568338.96200;5517132.37700;-
DEBY_LOD2_605662;97.81;38.89;568176.42100;5517187.76300;-
...
It is possible to define a translation table, written in an AlkisCodes.xml file, located in the same folder as the CityGML file:
<?xml version="1.0" encoding="UTF-8"?>
<codes xmlns:buLib="http://www.simstadt.eu/BuildingUsageLibraries" xmlns="http://www.simstadt.eu/AlkisCodes">
    <codesForBuildingUsageLibraryNamed>Germany_DIN18599-10</codesForBuildingUsageLibraryNamed>
    <code from="31001_1000" to="1010"/>
    <code from="31001_1010" to="1010"/>
    ...
    <code from="31001_3242" to="3242"/>
    <code from="31001_3260" to="3260"/>
    <code from="31001_9701" to="9701"/>
</codes>
The AlkisCode parameter can be activated in Usage Preprocessor, and the building functions should then be translated to known codes.
Only 1 building in model
If only one Building is found in the whole model, but the model looks fine otherwise (e.g. in Solar Potential Analysis), it means there might have been a problem during the export process. It can happen with SketchUp and GeoRES Plugin.
AccessDeniedException
SimStadt: 0.10.0-SNAPSHOT (refactor, rev. a86aac1, 20201130)
java.nio.file.AccessDeniedException: /home/ricou/Desktop/TestRepository/LaRéunion.proj/k.step
    at sun.nio.fs.UnixException.translateToIOException(UnixException.java:84)
    at sun.nio.fs.UnixException.rethrowAsIOException(UnixException.java:102)
    at sun.nio.fs.UnixException.rethrowAsIOException(UnixException.java:107)
    at sun.nio.fs.UnixFileSystemProvider.createDirectory(UnixFileSystemProvider.java:384)
    at java.nio.file.Files.createDirectory(Files.java:674)
    at java.nio.file.Files.createAndCheckIsDirectory(Files.java:781)
    at java.nio.file.Files.createDirectories(Files.java:767)
...
An AccessDeniedException means that SimStadt tries to create or modify a file or folder, and is not allowed to do so. It might happen if the repository is located:
- on a read-only network share.
- in a
Program Filesfolder. - in a folder owned by another user.
Solution: the Repository should be moved to a writable folder owned by the current user, e.g. on the Desktop or in Documents.
The program SimStadt itself can still be saved in a read-only location (e.g. Program Files).
java.lang.NoClassDefFoundError
SimStadt: development version (2021-02-09)

java.lang.NoClassDefFoundError: eu/simstadt/districtgraph/AutomaticDistrictHeating
    at de.hftstuttgart.simstadtworkflowsteps.energy.DistrictHeatingGenerator.lambda$0(DistrictHeatingGenerator.java:67)
    at java.util.stream.ReferencePipeline$3$1.accept(ReferencePipeline.java:193)
    at java.util.stream.ReferencePipeline$11$1.accept(ReferencePipeline.java:440)
...
Some workflows might fail when SimStadt GUI is run from Eclipse, and if the corresponding projects have been added to the Classpath but not to the Build Path.
Either:
- Run SimStadt from an extracted zip package
- Add the workflows to the Build Path
CityGML file cannot be selected in SimStadt
Only files ending with .gml can be imported in SimStadt.
On Windows, after a CityGML file has been edited in Notepad, it might get another extension (.txt), so that the model.gml file is actually saved as model.gml.txt, but only displayed as model.gml in File Explorer.
Since the file is now technically a .txt file, it won't be possible to use it as a CityGML model in SimStadt.
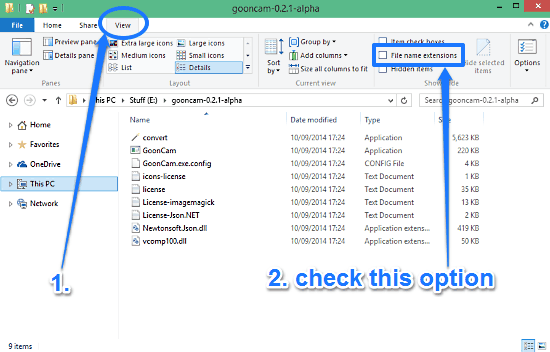
In order to remove the unneeded .txt, it might be necessary to first display the extensions (File Explorer > View tab > File name extensions). The complete filename is then displayed, and can be modified.
java.nio.file.FileSystemException
Simplified Radiosity Algorithm (SRA) might fail if the model is too large, or if not enough memory is available. Among other symptoms, the simulation might fail with java.nio.file.FileSystemException The process cannot access the file because it is being used by another process.
In this case, it might help to split the CityGML model in smaller tiles, which can be done automatically by selecting SRA_Perez_with_tiling in IrradianceProcessor.
Not enough VRAM for RegionChooser
java.lang.NullPointerException: Cannot invoke "com.sun.prism.d3d.D3DTextureData.getContext()" because the return value of "com.sun.prism.d3d.D3DTextureResource.getResource()" is null
        at javafx.graphics/com.sun.prism.d3d.D3DTexture.getContext(Unknown Source)
        at javafx.graphics/com.sun.prism.d3d.D3DTexture.update(Unknown Source)
        at javafx.graphics/com.sun.prism.d3d.D3DTexture.update(Unknown Source)
        at javafx.graphics/com.sun.prism.impl.BaseContext.flushMask(Unknown Source)
        at javafx.graphics/com.sun.prism.impl.BaseContext.drawQuads(Unknown Source)
        at javafx.graphics/com.sun.prism.impl.VertexBuffer.flush(Unknown Source)
        at javafx.graphics/com.sun.prism.impl.BaseContext.flushVertexBuffer(Unknown Source)
        at javafx.graphics/com.sun.prism.impl.ps.BaseShaderContext.setRenderTarget(Unknown Source)
        at javafx.graphics/com.sun.prism.impl.BaseContext.setRenderTarget(Unknown Source)
        at javafx.graphics/com.sun.prism.impl.BaseGraphics.<init>(Unknown Source)
        at javafx.graphics/com.sun.prism.impl.ps.BaseShaderGraphics.<init>(Unknown Source)
        at javafx.graphics/com.sun.prism.d3d.D3DGraphics.<init>(Unknown Source)
        at javafx.graphics/com.sun.prism.d3d.D3DGraphics.create(Unknown Source)
        at javafx.graphics/com.sun.prism.d3d.D3DSwapChain.createGraphics(Unknown Source)
        at javafx.graphics/com.sun.javafx.tk.quantum.PresentingPainter.run(Unknown Source)
        at java.base/java.util.concurrent.Executors$RunnableAdapter.call(Unknown Source)
        at java.base/java.util.concurrent.FutureTask.runAndReset(Unknown Source)
        at javafx.graphics/com.sun.javafx.tk.RenderJob.run(Unknown Source)
        at java.base/java.util.concurrent.ThreadPoolExecutor.runWorker(Unknown Source)
        at java.base/java.util.concurrent.ThreadPoolExecutor$Worker.run(Unknown Source)
        at javafx.graphics/com.sun.javafx.tk.quantum.QuantumRenderer$PipelineRunnable.run(Unknown Source)
        at java.base/java.lang.Thread.run(Unknown Source)
Please update to the latest SimStadt Version, or manually add -Dprism.maxvram=2G to line 10 of RegionChooser.bat script.
Empty Project List

If no project can be found in the drop-down menu, it might be because a project was selected instead of a repository.
Solution: make sure to set the Repository to the correct path, e.g. TestRepositoryWithCache, and not TestRepositoryWithCache/NYC.proj.
Ended: Getting started
About ↵
Authors
Here is the list of everyone who contributed to the SimStadt source-code1:
-
Eric Duminil
-
Kai Brassel
-
Matthias Betz
-
Romain Nouvel
-
Antoine Benoit
-
Marcel Bruse
-
Nazmul Alam
-
Habiburrahman Dastageeri
-
Parag Wate
-
Paul Debue
-
Sally Köhler
-
Verena Weiler
-
Pilar Monsalvete
-
Maryam Zirak
-
Keyu Bao
-
Sven Schneider
-
Volker Coors
Disclaimer
This program is distributed in the hope that it will be useful, but WITHOUT ANY WARRANTY; without even the implied warranty of FITNESS FOR A PARTICULAR PURPOSE.
License
SimStadt License : HfT Stuttgart © 2024
Release notes
Release 0.9.x
SimStadt moved to a fast release cycle in 2018, with a Jenkins continuous integration server.
Release 0.9 (17.07.2018, rev. 2e0202ce)
Highlights
- PVPotential : Facade integration
- Updated BuildingPhysicsLibrary:
- EnEV 2016 as refurbishment variant.
- Integration of Interior Walls, Shared Walls and Intermediary Floors in the BuildingPhysicsLibrary Structure
- Updated RegionChooser : Faster and automated parsing of every citygml file
- PLUTO attributes are considered so that NYC buildings can be simulated
- Cooling demand with DIN18599.
- Updated RegionChooser interface.
Important Bug Fixes
- Hourly temperatures were allowed to deviate 2°C from the measured monthly average.
- Some values were incorrect in BuildingPhysics ( *concrete slab insul – 6cm * MFH 84-94 top ceiling * 1984-1994 MedRef)
Known Bugs and Limitations
- Stopping of running workflows is still not implemented
- Meteonorm files can be imported, but the 30 minute offset they include doesn’t fit well with irradiance calculations. Optimum azimuth might be off by about 30°.
- Only works with Java 8.
Release 0.8 (29.06.2016, rev. 1831)
Highlights
- Calculation of the embodied energy, embodied carbon, disposal energy and disposal carbon for the building materials integrated in the Environmental Analysis workflow (results to be found in the .out report of the workflowstep PrimaryEnergyAndCO2Balance.
- The CityGML parameters storeysAboveGround and storeysHeightsAboveGround in the CityGML files are now considered in the BuildingPhysicsPreprocessing of SimStadt.
- New radiation models :
- INSEL Perez
- tiled SRA, for large Citygml files
- SRA without shadows, for comparisons with SRA
- Possibility to specify pipe costs for DistrictHeating.
- RegionChooser now accepts New-York City Citygmls.
- PVPotential can be used with SRA.
- Contour plots for irradiances are now available in SolarPotentialAnalysis
Important Bug Fixes
- SRA calculations were using the wrong average, and were about 6% too high.
- Cli files had a 1h offset.
- Correction of the non-residential usage conditions of the building usage library.
- Timezone was hard-coded to GMT+1, it now depends on the location.
Known Bugs and Limitations
- Some workflows created with SimStadt 0.7 or earlier cannot be read and processed by the current release. Remove old workflows from repository if needed.
- Stopping of running workflows is still not implemented
- RegionChooser still needs a lot of RAM, and cannot process large (>400MB) CityGML files
- Meteonorm files can be imported, but the 30 minute offset they include doesn’t fit well with irradiance calculations. Optimum azimuth might be off by about 30°.
- ShadowProcessing only works in Eclipse, not in deployed Simstadt
Release 0.7 (4.4.16, rev. 1615)
Highlights
- Many improvements on workflows Heat Demand Analysis and District Heating Network Analysis.
- Documentation of workflows have been improved and are accessible now for all SimStadt users via the Redmine Wiki. Note especially the plausibility check for Heat demand analysis results.
- New API and deployment mechanism for publishing workflows as web-services (see module MonthlyEnergyBalanceWebService as an example)
- New workflow step to access real time monitor data from a web-service (EMTools)
- Time consuming operations like selecting a workflow for the first time now give feedback to the user and block the GUI
- Special workflow step for creating charts (see http://simstadt.hft-stuttgart.de/wiki/index.php/Chart_Step).
Important Bug Fixes
- Copying, deleting and renaming workflows now work as expected
- Cooling calculation in Map in Heat Demand Analysis not allowed as long as it is not validated
- Probabilistic distribution algorithm in the Assessment scenario of PhysicsPreprocessor W-step has been corrected.
Other Important Changes
- Improvements of building and usage library data, e.g. new building typology, including EneV 2014 and Effizienzhaus
- Modular and headless deployment of SimStadt platform, workflows and web-services, now including JavaDoc files and sources
- Local test data and better naming of tests introduced in some modulesReplaced BuildingFilter by CreateSimStadtModel in all workflows
- Improvement of overall modul structure and systems architecture.
Known Bugs and Limitations
- Workflows created with rel. 0.6 or earlier cannot be read and processed by the current release
- Stopping of running workflows is still not implemented
- The button for suppressing maps which was a bad workaround for dealing with memory leaks has been removed. However, the leaks are still there (see bug #251) and must be addressed soon.
Release 0.6 (9.11.15, rev. 1401)
Highlights
- GUI improvements:
- Top level workflow are selected automatically when displayed and show the workflow type.
- Rearranged file views and added a third view on files in the repository root
- File and parameter panels may now be hidden (Task #486)
- Rearranged SimStadt toolbar items
- Result files are now written into the according workflow-step directory (Task #256).
Important Bug Fixes
- Buildings without geometries are now ignored by the geometric preprocessor.
Other Important Changes
- Changes in API for assembling workflows
- Library controlsfx updated to release 8.40.9 (resolves rendering issues)
- Enforce usage of JRE 1.8.0_40 or higher under windows.
Known Bugs and Limitations
Due to Java bug https://bugs.openjdk.java.net/browse/JDK-8136466 RegionChooser will not work with JRE versions between 1.8.0u60 and 1.8.0u71 (a bugfix is announced for 1.8.0u72). However, it works with all Java versions from 1.8.0u40 on if starting from Eclipse. Workflows created with rel. 0.5 can be opened and edited but not executed in rel. 0.6, since their type is regarded as unknown. If required, this can be fixed by manually by adding these lines to the top level params.xml with the respective path to the correct workflow provider class:
<void property="workflowProvider">
    <object     class="de.hftstuttgart.simstadtworkflows.energy.MonthlyEnergyBalanceWorkflowProvider"/>
</void>
Release 0.5 (02.10.15, rev. 1373)
Highlights
- Added a file panel for project files as well as a panel for the files belonging to the currently selected workflow step. Files can be opened by double click and moved/copied via drag'n'drop.
- Modified vizualisation, with improved zoom
- Updated Library Editor
- Update to CityDoctor v2.1 which supports the CityGML vegetation feature.
Other Important Changes
- GML-Ids of generated boundary surfaces will be named after the polygon for which it has been generated.
Known Bugs and Limitations
- All workflow tests are broken. They will get fixed when Kai comes back.
Release 0.3 (21.07.15, rev. 1346)
Highlights
"RegionChooser" stand-alone application for interactively defining regions on a map to be imported from novaFactory or to define sub-regions of already imported regions (for details see https://simstadt.hft-stuttgart.de/related-softwares/region-chooser/) · These four new or improved workflows are tested and supported and, thus, may be used for project work: * Solar Potential Analysis (legacy with Gnuplot) * PV Potential Analysis * Monthly Heat Demand Analysis * Carbon and Primary Energy Analysis * Improved usage library version 2 and all new usage library editor. Some features: * Tabs for the end uses and profiles in these tabs instead to be in a pop-up * Alert when a mapping is missing * Text recognition in the mapping table * Unit converters * Variant table For details go to https://simstadt.hft-stuttgart.de/related-softwares/building-usage-library/ * New API for assembling workflows: * Workflows on top-level are not represented by a sequence of steps anymore, but by a single "top-level workflow step". That way, top-level and sub-level workflows can be unified, and there is no need for special "workflow start steps" anymore. * Starting with this release, workflows can be implemented and compiled in their own modules. The resulting jar files can be added to an existing SimStadt installation, that detects and incorporates the new workflows at start-up.
Other Important Changes * Enforce 64-bit architecture when starting SimStadtApp * Caching of intermediate weather and radiation data for faster workflow processing * 45% faster calculation of irradiance in the workflow step radiation processor * Tooltip indicating the ID of the building and its value in maps * New experimental workflow for shadow processing working fast on the graphics card with OpenCL including a new 3D Viewer which is still under construction * Better API and exception handling for accessing CityGML coordinate systems * New "About"-Dialog displaying version and system properties important for bug reports. The dialog is accessible from the tools popup menu in the toolbar.
Important Bug Fixes * CSV Export now works everywhere as expected * Bug #319 sometimes prevents starting a new version of SimStadt if the repository worked with recently has gotten incompatible with the new version.
Known Bugs and Limitations 1. Top-level workflow steps always display text "files: 0" that can be ignored. 2. Executing workflows in batch mode may crash at some time with an OutOfMemory exception. Workaround: Select "Suppress Maps" in the toolbar. 3. While you can add and copy workflows (workflow steps), commands for deleting or renaming projects and workflows are not implemented yet. Workaround for renaming or deleting a workflow step: Quit Simstadt, rename or delete the workstep folder, start SimStadt again. 4. Running workflows cannot be stopped yet. 5. For other bugs and limitations see our Redmine issue tracker.
Release 0.2.1 (31.03.15, rev. 1173)
Highlights
- New module DistrictGraph for automatic generation of district heating networks and experimental workflow with StaNet integration (requires Gnuplot)
- Auto-download of Open Street Maps
- Many improvements and bug fixes in the workflow step's graphical output (feature #213), e.g. new options to export CVS and PNG files
- Many improvements of the building physics library editor
- Release requires JRE 8u40 (64 bit) or higher and citydoctordata/mathutils-1.3
Other Important Changes
- Code refactoring and adding JavaDocs
- Documentation of Geometric Preprocessing in Wiki (task #200)
- Enhancements for monthly energy balance workflow DIN18599, e.g. sum up heat demand over building classes like public buildings
- Adding SRA as an option for RadiationProcessor, e.g. in DIN18599 workflows
- Enhancements for PVPotential workflow (feature #216)
- SimStadtModel now extracts coordinateReferenceSystem from srsName attribute in CityGML. (rev. 1005)
- Improved deployment, support of MacOS X (rev. 1013)
- SunWindExposedEngine considers all LODs in any case (task #227)
- Capability to map custom ALKIS codes to standard ones (feature #134)
Important Bug Fixes
- Generated boundary surfaces for LOD1 geometries had no link to their corresponding polygons and building instances (rev. 962)
- Solar gains through ground surface not calculate anymore (rev. 994)
- Different results for one building AND multiple calls of FacadeCalculator.facadeCalc4Building() for one building (bug #211)
- Adding polygons to generated boundary surfaces fails (bug #229)
- Mixed usage types as displayed in UsagePreprocessor seem to be wrong (bug #241)
Known Bugs and Limitations
1. Executing workflows in batch mode may crash at some time with an OutOfMemory exception.
2. While you can add and copy workflows (workflow steps), commands for deleting or renaming projects and workflows are not implemented yet.
Workaround for renaming a workflow step: Quit Simstadt, rename the workstep folder, start SimStadt again. 3. Running workflows cannot be canceled yet. Workaround: Quit Simstadt. 4. For other bugs and limitations see our Redmine issue tracker.
Release 0.2 (17.02.15, rev. 946)
Highlights
- First deployed (stand alone) release of SimStadt platform. Contains: Engine for hierarchical workflows, CityDoctor libraries
- Reads and writes CityGML files with EnergyADE 0.2
- Considerably stable and fast
- Rich interactive GUI for parameterizing workflow steps and analyzing results
- May also run in batch mode
- Two tested workflows for project "Landkreis Ludwigsburg" (DIN18599 and PV Potential Analysis) and other experimental workflows are available
- Comes with an sophisticated editor for building physics default data.
Publications
This is an overview of the SimStadt-related papers that have been published either in scientific journals or have been presented at conferences.
2022
Bao, Keyu and Kalisch, Louis and Santhanavanich, Thunyathep and Thraen, Daniela and Schroeter, Bastian. A bottom-up GIS-based method for simulation of ground-mounted PV potentials at regional scale in Energy Reports (8, 2022, 5053-5066).
Abstract: Solar photovoltaic (PV) is a key technology for any renewable energy system. As subsidy-free PV becomes more and more economically feasible, region-specific planning tools that define areas suitable for ground-mounted PV are needed. While many top-down studies have assessed suitable areas at a national scale, an accurate scalable bottom-up assessment of regional ground-mounted PV potentials in high spatial and temporal resolution that goes further than a mere identification of appropriate land areas is missing. This work introduces such a method based on digital landscape models that consider terrain slope, orientation, location-specific irradiation, and land use type, and combines this geoinformatical information with a PV yield model that allows to assess hourly PV generation potential on suitable areas. The method is validated with three existing ground-mounted PV plants in Germany, where a comparison of real and simulated annual electricity yields shows average deviations of 5%. Subsequently, ground-mounted PV potentials in three German counties with varying settlement structures as well as topographic and weather patterns are assessed and a comparison of yearly and hourly simulated generation potentials with regional electricity demand is performed. While the yearly analysis demonstrates the substantial overall potentials of local ground mounted-PV in all regions, with demand coverages ranging from 80% to hypothetically more than 40 times of current electricity demand according to current regulations, the hourly autarky ratio, defined as the share of hours of a year where ground-mounted PV can satisfy demand, ranges from 25% to 40%, without consideration of storage or demand side management. A subsequent investigation of the ability to export excess electricity generation from ground-mounted PV shows that the two regions with highest ground-mounted PV potentials have less-developed grid infrastructures, thus restricting excess electricity generation export potentials. Keywords: Photovoltaic; Ground-mounted PV; Bottom-up simulation; Geographic Information System (GIS); Food–water–energy nexus; Potential simulation
Verena Weiler, Daniel Lust, Marcus Brennenstuhl, Kai-Holger Brassel, Eric Duminil, Ursula Eicker. Automatic dimensioning of energy system components for building cluster simulation, in Applied Energy (Volume 313, 2022, 118651, ISSN 0306-2619)
Abstract: In this paper, we present an approach on automatic energy system modeling and simulation. We develop two different methods to dimension the components of energy systems: one approach is an easy-to-use and to-adapt rule-based method, where the size of components is based e.g. on the heat demand of the buildings. The second approach is to dimension components with a genetic algorithm with a target function to reduce total annual cost. We apply and compare the methods for two different system designs to a building cluster case study in Germany. One system is a decentral heat pump system with back-up gas boiler, thermal and electrical storage and PV, the other system is a hydrogen-based central fuel cell system with electrolyzer, thermal and electrical storage and PV. We compare both systems based on current (2020) and future (2050) framework conditions. Through the application of the genetic algorithm a reduction of equivalent annual cost of up to 27% (2020 scenario) and 21% (2050 scenario) is achieved for the heat pump system. The hydrogen system with optimized dimensioning becomes economically viable under 2050 conditions due to reduced fuel prices and a higher electricity feed-in tariff compared to 2020. Depending on the use case, both approaches have their merit: rule-based dimensioning can quickly simulate a variety of different scenarios, the genetic algorithm can achieve economically ideal system designs, but with longer computation time, especially with unfamiliar framework conditions.
Keywords: Urban simulation; System dimensioning; Genetic algorithm; Total annual cost; Modular approach; Power-to-hydrogen
2021
Köhler, S., Betz, M., Duminil, E., Eicker, U., & Schröter, B. (2021, June). A holistic approach to model electricity loads in cities. In Sustainability Management Forum | NachhaltigkeitsManagementForum (Vol. 29, No. 2, pp. 143-152). Berlin/Heidelberg: Springer Berlin Heidelberg
Time-resolved, occupancy-dependent electricity load profiles at building level for city quarters or entire cities are important for planning authorities, project developers, utilities or other stakeholders in order to develop energy saving strategies and meet climate targets. Firstly, this information enables a more accurate modelling of renewable energy systems. Secondly, aspects like sector coupling, storage decisions and the impact of technologies such as electric vehicles or heat pumps on the grid can be considered. Thirdly, it allows a more detailed economic analysis. This paper contains the newly added features to the simulation environment SimStadt, which is used for strategic modelling of sustainable urban or regional areas with a spatial resolution at the building level. SimStadt interlinks 3D CityGML models with parameters for buildings physics to simulate energy demands and renewable energy potential. It was enhanced by the development of an electricity load profile generator with variable resolution and the addition of an hourly resolved PV potential analysis including a variable economic analysis. This enables e.g. the evaluation of photovoltaic potential with the associated investment, operating and levelized costs over the lifetime of hundreds of individual buildings in parallel. Together with additional electric building demand from heat pumps, electric vehicles or load shifting options through the use of battery storage, it will be possible to assess and compare the feasibility, benefits and economic viability of energy/electricity-related urban renewal measures in even greater detail and with a holistic perspective. The simulation platform enables the development of granular sustainable urban (sub)strategies and energy concepts through a holistic, time-resolved, building-specific approach to support transformation of the building stock to a sustainable, low-carbon one.
Weiler, Verena; Duminil, Eric; Schröter, Bastian; Coors, Volker; Brüggeman, Thilo; Balbach, Bodo; Goll, Laura, Klöber, Andreas. Automatisierte Modellierung von Quartierswärmebedarfen auf Basis von 3D-Gebäudemodellen. EuroHeat&Power 4-5.2021.
Abstract: Eine nachhaltige Wärmeversorgung von Bestands- und Neubauquartieren kann maßgeblich dazu beitragen, die klimapolitischen Zielsetzungen Deutschlands und der EU zu erreichen. Der 3D-Gebäudeenergie-Workflow-Manager SimStadt hilft dabei, die energetische Quartiersplanung zu vereinfachen.
Weiler, Verena; Duminil, Eric; Balbach, Bodo; Schröter, Bastian; Tool Development for Automatic Simulation of central and decentral Heat Supply Scenarios and Application to a district in the City of Mainz, Germany (SimStadt 2.0 project). Building Simulation 2021 Conference, Bruges
Abstract: Often enough, when new constructions or changes in existing built-up areas are planned, energetic assessments such as the choice among heat supply options, are done at a late stage in the process, with key decisions on the area already made. Our tool, called SimStadt, enables local decision makers to perform an early-stage analysis of possible planning scenarios, with limited data requirements on the technical backgrounds and exact design of potential future scenarios. SimStadt is a scientific workflow management platform, which can be coupled to a number of external tools and libraries. The existing functionalities have been described in various publications ([1]–[4]) and shall not be the focus here. The new developments in the (ongoing) SimStadt 2.0 project are the connection of heat demand calculations to heat supply models. They are modelled in INSEL (www.insel.eu), with the district heating network dimensioned in more detail in STANET (www.stafu.de/en). Additionally, an energy components library contains relevant parameters for various heat supply models. The new development was tested with a district of 65 buildings in Mainz, Germany, where options for a central network system were compared against a decentral air-water heat pump system along technical and economic indicators.
2020
Dochev, Ivan; Gorzalka, Philip; Weiler, Verena; Estevam Schmiedt, Jacob; Linkiewicz, Magdalena; Eicker, Ursula; Hoffschmidt, Bernhard; Peters, Irene; Schröter, Bastian. Calculating urban heat demands: An analysis of two modelling approaches and remote sensing for input data and validation. Energy & Buildings 226.
Abstract: Building stocks account for a large share of energy consumption and harbour great potential for reducing greenhouse gas emissions. The field of urban building energy modelling (UBEM) offers a range of approaches to inform climate protection policies, producing output of different granularity and quality. We compare two typology-based (archetype) approaches to urban heat demand calculation in a mixed-use area in Berlin, Germany. The goal is to show challenges and pitfalls and how remote sensing can improve the modelling. The first approach uses 2D cadastral data and specific heat demand values from a typology. For the second approach, we derive a 3D building model from aerial imagery, use parameters from the same typology, and calculate the heat balance for each building. We compare the differences in several geometric parameters, U-values and the heat demand. Additionally, we analyse if window detection on aerial image textures and surface temperatures from aerial infrared thermography can improve the estimated window-wall ratios and U-values. The two heat demand approaches lead to different results for individual buildings. Averaging effects reduce the differences at an aggregated level. Remote sensing can be used to improve some geometric parameters needed for modelling, but still requires additional research regarding U-value estimation.
Eicker, Ursula, Weiler, Verena, Schumacher, Jürgen, Braun, Reiner. On the design of an urban data and modeling platform and its application to urban district analyses. Energy and Buildings 217.
Abstract: An integrated urban platform is the essential software infrastructure for smart, sustainable and resilient city planning, operation and maintenance. Today such platforms are mostly designed to handle and analyze large and heterogeneous urban data sets from very different domains. Modeling and optimization functionalities are usually not part of the software concepts. However, such functionalities are considered crucial by the authors to develop transformation scenarios and to optimize smart city operation. An urban platform needs to handle multiple scales in the time and spatial domain, ranging from long term population and land use change to hourly or sub-hourly matching of renewable energy supply and urban energy demand.
The paper discusses software architecture concepts for data and modeling urban platforms, which allow to analyze and optimize the urban infrastructure with their energy, water and further resources such as food or goods consumption. Building, commerce and industry as well as the transport sector are in the focus of the efficiency and renewable supply analysis. The main driver is to derive zero carbon strategies for cities while including all major sectors of CO2 generation.
Coors, Volker; Matthias Betz; Duminil, Eric. A Concept of Quality Management of 3D City Models Supporting Application-Specific Requirements. PFG–Journal of Photogrammetry, Remote Sensing and Geoinformation Science (2020): 1-12.
Abstract: In this paper, a novel approach to specify application-specific requirements for 3D City Models is proposed. A modular set of geometric and semantic requirements that are based on the OGC CityGML Quality Interoperability Experiment (Coors and Wagner in Fernerkundung und Geoinformation eV 24:288–295, 2015) has been specified. Depending on the purpose of the model, not all requirements are mandatory. For example, if the model is used for visualization only, solid geometry is not required. However, if the same model should be used for analytic purpose such as heating demand simulation, solid geometry is mandatory. A formal definition of a validation plan is proposed in this paper to specify the application-specific set of requirements. This gives the city model manufacturers the possibility to provide proof that their model is usable in certain applications and can certify a certain level of quality. The concept is evaluated with the definition of a validation plan for heating demand simulation. It has been successfully implemented using the Software CityDoctor and SimStadt.
Bao, Keyu; Rushikesh Padsala; Volker Coors; Daniela Thrän; Bastian Schröter. GIS-Based Assessment of Regional Biomass Potentials at the Example of Two Counties in Germany. 28th European Biomass Conference and Exhibition Proceedings, pp. 77-85. 2020.
Abstract: The assessment of theoretical and technical biomass potential from different types of natural land cover is an integral part of simulation tools that aim to assess local multi-energy systems. This work introduces a new workflow which evaluates the local biomass potential from various sources, its transformation to different forms of biofuel and their thermal and electrical energy potentials, based on GIS-based land use data, satellite map on local crop types, and crop-specific energy yields from literature. One of the workflow’s two test cases is the county of Ludwigsburg in the south of Germany, where the annual technical local biomass potential was calculated to be close to 700 GWh, or 8% of total electricity and heating demand (based on 2018 demand data) – compared to an actual contribution of biomass to the local energy mix of about 2% (2012). The second test case is the northern German county of Dithmarschen, where local technical biomass is about 2248 GWh, or 19% of electricity and heating demand according to our simulation. Under current utilization situation bioenergy potential s are not completely in use and can contribute to local energy concept. This new workflow will further complement an existing local energy system simulation platform that has so far focused on urban energy demands and potentials.
Bao, Keyu; Rushikesh Padsala; Volker Coors; Daniela Thrän; Bastian Schröter. A Method for Assessing Regional Bioenergy Potentials Based on GIS Data and a Dynamic Yield Simulation Model. Energies 13, no. 24 (2020): 6488.
Abstract: The assessment of regional bioenergy potentials from different types of natural land cover is an integral part of simulation tools that aim to assess local renewable energy systems. This work introduces a new workflow, which evaluates regional bioenergy potentials and its impact on water demand based on geographical information system (GIS)-based land use data, satellite maps on local crop types and soil types, and conversion factors from biomass to bioenergy. The actual annual biomass yield of crops is assessed through an automated process considering the factors of local climate, crop type, soil, and irrigation. The crop biomass yields are validated with historic statistical data, with deviation less than 7% in most cases. Additionally, the resulting bioenergy potentials yield between 10.7 and 12.0 GWh/ha compared with 13.3 GWh/ha from other studies. The potential contribution from bioenergy on the energy demand were investigated in the two case studies, representing the agricultural-dominant rural area in North Germany and suburban region in South Germany: Simulation of the future bioenergy potential for 2050 shows only smaller effects from climate change (less than 4%) and irrigation (below 3%), but the potential to cover up to 21% of the transport fuels demand in scenario supporting biodiesel and bioethanol for transportation.
Bao, Keyu; Rushikesh Padsala; Daniela Thrän; Bastian Schröter. Urban Water Demand Simulation in Residential and Non-Residential Buildings Based on a CityGML Data Model. ISPRS International Journal of Geo-Information 9, no. 11 (2020): 642.
Abstract: Humans’ activities in urban areas put a strain on local water resources. This paper introduces a method to accurately simulate the stress urban water demand in Germany puts on local resources on a single-building level, and scalable to regional levels without loss of detail. The method integrates building geometry, building physics, census, socio-economy and meteorological information to provide a general approach to assessing water demands that also overcome obstacles on data aggregation and processing imposed by data privacy guidelines. Three German counties were used as validation cases to prove the feasibility of the presented approach: on average, per capita water demand and aggregated water demand deviates by less than 7% from real demand data. Scenarios applied to a case region Ludwigsburg in Germany, which takes the increment of water price, aging of the population and the climate change into account, show that the residential water demand has the change of −2%, +7% and −0.4% respectively. The industrial water demand increases by 46% due to the development of economy indicated by GDP per capita. The rise of precipitation and temperature raise the water demand in non-residential buildings (excluding industry) of 1%.
2019
Eicker, Ursula; Schumacher, Jürgen; Weiler, Verena; Braun, Reiner On the design of an urban modelling platform and its application for a New York analysis at IBPSA Building Simulation Rome
Abstract: Urban platforms are essential for smart and sustainable city planning and operation. Today they are mostly designed to handle and connect large urban data sets from very different domains. Modelling and optimisation functionalities are usually not part of the cities software infrastructure. However, they are considered crucial for transformation scenario development and optimized smart city operation. The work discusses software architecture concepts for such urban platforms and presents case study results on the building sector modelling, including urban data analysis and visualisation. Results from a case study in New York are presented to demonstrate the implementation status.
Köhler, Sally; Betz, Matthias; Eicker, Ursula Stochastic generation of household electricity load profiles in 15 minute resolution on building level for whole city quarters at 16th IAEE Conference Ljubljana
Abstract: This paper presents a new method for generating synthetic household electricity load profiles by using a small data set of measured time series data as an input. In general, electricity demand can be determined by either bottom-up or top-down methods. The bottom-up method is very detailed, taking single devices and user occupancy into account [1]. Top-down modelling uses regionally aggregated data [2] to draw conclusions about consumption based on building characteristics and attributes. The method presented is neither one of the mentioned above but a black-box modelling approach. Goal of this study is to simulate building electricity demand with as little input data as possible, while taking stochastics and randomness of occurrences into account. Additionally, this method should be able to produce synthetic time series with a customizable resolution on single building level for whole city quarters (up to several 100 buildings). Simultaneously the time complexity of the algorithm should be reasonable. Most of the freely available existing synthetic load profile generators work with a bottom-up approach, like [3] or [4] and are applicable only for a certain amount of households/buildings before the computational effort gets impractical. This study uses 3D CityGML files as a source of information for building properties and then applies the new method to the building stock using SimStadt as simulation platform.
Mittelstädt, Alexandra; Köhler, Sally; Kesnar, Chris; Sihombing, Rosanny; Duminil, Eric; Coors, Volker; Eicker, Ursula; Schröter, Bastian A multi-scale, web-based interface for strategic planning of low-carbon city quarters at ICUI Hongkong
Abstract: SimStadt is a simulation environment for strategic modelling of sustainable city quarters and other urban or regional areas. It interlinks GIS-based 3D city models with stationary or dynamic building models and power generation technologies, integrating them into a user-friendly, web-based platform. It allows evaluating potentials and relevant cost parameters for increased building energy efficiency as well as renewable power generation in a given geography. Today, SimStadt can assess the changes in the heat demand of buildings through energetic refurbishment scenarios. Furthermore, it can evaluate the potential for photovoltaics (PV) and solar thermal energy and the associated investment, operating and levelized costs over the lifetime of hundreds of individual buildings in parallel. This will be supplemented in the near future by other renewable energy technologies such as wind, biomass and geothermal energy, thus making it possible to assess the feasibility, benefits and economic viability of energy-related urban renewal measures and to compare them with each other in even greater detail and on a more holistic basis. SimStadt enables its users to develop granular sustainable city (quarter) strategies and energy concepts through an intuitive, web-based interface and supports them in promoting the energy system transformation on an urban and local level.
Weiler, Verena; Stave, Jonas; Eicker, Ursula Renewable energy generation scenarios using 3D urban modeling tools—methodology for heat pump and co-generation systems with case study application in Energies
Abstract: In the paper, a method was developed to automatically dimensionalize and calculate central energy generation and supply scenarios with a district heating system for cities based on 3D building models in the CityGML format and their simulated heat demand. In addition, the roof geometry of every individual building is used to model photovoltaic energy generation potential. Two types of supply systems, namely a central heat pump (HP) system and a large co-generation (combined heat and power-CHP) system (both with a central storage and district distribution system), are modeled to supply the heat demand of the area under investigation. Both energy generation models are applied to a case study town of 1610 buildings. For the HP scenario, it can be shown that the case study town’s heat demand can be covered by a monovalent, low-temperature system with storage, but that the PV only contributes 15% to the HP electricity requirement. For the CHP scenario, only 61% of the heat demand can be covered by the CHP, as it was designed for a minimum of 4000 operating hours. Both the PV and the CHP excess electricity are fully injected into the grid. As a result, the primary energy comparison of both systems strongly depends on the chosen primary energy factors (PEF): with given German regulations the CHP system performs better than the HP system, as the grid-injected electricity has a PEF of 2.8. In the future, with increasingly lower PEFs for electricity, the situation reverses, and HPs perform better, especially if the CHP continues to use natural gas. Even when renewable gas from a power to gas (P2G) process is used for the CHP, the primary energy balance of the HP system is better, because of high conversion losses in the P2G process.
Weiler, Verena; Würstle, Patrick; Schmitt, Andreas; Stave, Jonas; Braun, Reiner; Zirak, Maryam; Coors, Volker; Eicker, Ursula Methoden zur Integration von Sachdaten in CityGML Dateien zur Verbesserung der energetischen Analyse von Stadtquartieren und deren Visualisierung at BauSIM 2018 Karlsruhe
Abstract: Auf Basis von 3D-Gebäudemodellen im CityGML-Standard kann mit der Simulationsplattform SimStadt unter anderem der Heiz- und Kühlenergiebedarf von Gebäuden sowie das PV Potential in Stadtquartieren berechnet werden. In der Praxis zeigt sich jedoch, dass Informationen wie Gebäudebaujahr, Sanierungsfortschritt oder genaue Angaben zur Nutzung der Gebäude teilweise fehlen oder fehlerhaft sind und somit nicht ausreichend, um gesamte Quartiere im gewünschten Detailierungsgrad zu analysieren. In diesem Artikel werden verschiedene Ansätze methodisch vorgestellt, wie eine Anreicherung der Eingangsdaten aus verschiedenen Quellen, wie OpenStreetMap oder durch Crowdsourcing durchgeführt werden und dadurch eine Verbesserung des Simulationsmodells erreicht werden kann.
Weiler, Verena; Eicker, Ursula Individual Domestic Hot Water Profiles for Building Simulation at Urban Scale at IBPSA Building Simulation Rome
Abstract: Many urban simulation tools focus mainly on the calculation of space heating (SH) demand and not on the domestic hot water (DHW) demand. Instead, DHW is often assumed as an always constant value that does not change during the day or year. In this paper, the importance of differentiated, hourly domestic hot water profiles for residential buildings in urban energy demand simulations is shown. The comparison between the use of DHW profiles and the use of a constant value for the DHW demand shows a high underestimation of the DHW demand during the morning peaks on weekdays and in the afternoon on weekends, as well as a high overestimation of the demand during the night. There is also a notable difference between summer and winter days, which is not represented when using a constant value.
Zirak, Maryam; Weiler, Verena; Hein, Martin; Eicker, Ursula Urban models enrichment for energy applications: Challenges in energy simulation using different data sources for building age information in Energy
Abstract: 3D city models are increasingly used for heating demand analyses at urban scale. Many studies have been done for standardization of required attribute data for energy analysis of buildings. The U-values which can be derived from the building age are one of the main influencing attributes for heat demand modelling. The question remains how building age can be provided. Often, the information on the year of construction of each building is not accessible. On the other hand, statistics about building ages are often available on an aggregated level. This paper compares data provided by municipalities to two statistical data sources: Census 2011 data on municipality level and country-wide statistics for Germany. The result shows building age distribution presented by the census leads to an acceptable total heat demand prediction compared with the results based on the data from the municipality. Therefore, the decision making at urban level can rely on census data if more detailed information is unavailable or inaccessible. Moreover, the role of refurbishment data is discussed in the paper. Finally, it is recommended to standardise census data for different applications. For energy application, distribution of building age over living area is more demanded than over the number of buildings.
2018
Braun, Reiner; Weiler, Verena; Zirak, Maryam; Dobisch, Lara; Coors, Volker; Eicker, Ursula Using 3D CityGML Models for Building Simulation Applications at District Level at IEEE International Conference on Engineering, Technology and Innovation Stuttgart
Abstract: The paper analyses the potential of 3D CityGML geometry models for building heating demand simulation. Various aspects of processing 3D data to make it suitable for building simulation are discussed. To validate and calibrate the simulation models, block level aggregated heating consumption data for the city district of Stuttgart Stöckach was used in conjunction with other data such as weather data. The work tries to identify sources of problems in the workflow of using 3D city models and other data bases such as building physics or usage libraries which can lead to a deviation between simulated and measured demand. Depending on the type of CityGML data, adjustments might be necessary to account for missing terrain intersection curves, for wrong wall or roof attributes etc. Only if the 3D model is of sufficient quality, heating demand simulations can yield realistic values. For the case study district the corrections improved the initial mean error of 61% to 29%. A higher accuracy could be achieved for building blocks which have a high share of residential buildings.
Weiler, Verena; Stave, Jonas; Eicker, Ursula Assessment of different renewable energy generation scenarios using 3D urban modelling tools at 13th SDEWES Conference Palermo
Abstract: In the paper, a method was developed to automatically generate energy supply scenarios for cities based on 3D building modelling of the heat demand. In addition, the roof geometry of every individual building was used to model photovoltaic energy generation. From the heat demand analysis hourly load profiles were derived and used to dimension two types of supply systems, namely a heat pump (HP) and a cogeneration (combined heat and power - CHP) system with storage and distribution system. For the HP scenario, it could be shown that the case study city´s heat demand could be covered by a monovalent, low temperature system with storage, but that the PV only contributed 15% to the HP electricity requirement. For the CHP scenario, only 61% of the heat demand could be covered by the CHP, as it was designed for a minimum of 4,000 operating hours. Both the PV and the CHP electricity are fully injected into the grid. As a result, the primary energy comparison of both systems strongly depends on the chosen primary energy factors (PEF): with given German regulations the CHP system performs better than the HP system, as the grid injected electricity has a PEF of 2.8. In the future with increasingly lower PEFs of electricity, the situation reverses and HPs perform better, especially if the CHP continues to use natural gas. Only if biogas or power to gas (P2G) from renewables is used for the CHP, the primary energy balance of the CHP system can compete with the HP system.
2017
Eicker, Ursula; Harter, Hannes; Weiler, Verena Life cycle assessment of buildings and city quarters analysing the influence of different climatic conditions at 15th IBPSA Building Simulation Conference San Francisco
Abstract: In this study, a method for evaluating the energy demand and greenhouse gas emissions during the three life cycle stages production, use and end-of-life of a building or city quarter is presented and applied to different case studies. The main result is that from the life cycle energetic point of view, refurbishment to a high building standard is better than demolition and reconstruction to a similar standard under the condition that the structural condition of the building allows it. The analysis includes different climatic conditions and their high influence on the life cycle energy demand and greenhouse gas emissions.
Harter, Hannes; Weiler, Verena; Eicker, Ursula Developing a roadmap for the modernisation of city quarters – Comparing the primary energy demand and greenhouse gas emissions in Building and Environment
Abstract: In this study, a new method based on 3D urban geometry in CityGML format is presented and used to evaluate the energy demand and greenhouse gas emissions during the different life cycle stages of a city quarter. The method is applied to a case study in Stuttgart/Germany, while considering the specific building characteristics of the city quarter. Four different development scenarios to reach a similar building standard for all residential buildings are assessed, which include either the refurbishment or the demolition and reconstruction or a combination of both. The total reduction of the primary energy demand for building operation is the same in each scenario. However, different production and construction energy inputs are needed for the four scenarios, which are highest for new constructions. The end-of-life energy demand is negligible by comparison. This leads to the conclusion that from the life cycle energy point of view, refurbishment to a high building standard is better than reconstruction under the condition that the structural condition of the building allows it. If the plan is to refurbish or partially reconstruct all buildings in a city quarter, a specific order needs to be chosen. This order has a high influence on the temporal development of the energy demand reduction of the city quarter.
Monien, Dirk; Stzalka, Aneta; Koukofikis, Athanasios; Coors, Volker; Eicker, Ursula Comparison of building modelling assumptions and methods for urban scale heat demand forecasting in Future Cities and Environment
Abstract: Building energy evaluation tools available today are only able to effectively analyse individual buildings and usually either they require a high amount of input data or they are too imprecise in energy predictions at a city (district) scale because of too many assumptions made. In this paper, two tools based on 3D models are compared to see whether there is an approach that would probably be able to fit both – the amount of data available and the number of assumptions made. A case study in the German town of Essen was chosen in the framework of the research project WeBest, where six building types representing the most important building periods were analysed. The urban simulation tool SimStadt, an in-house development of HFT Stuttgart, based on 3D urban geometry, is used to calculate the heat demand for both single building scale and city district scale. The individual building typology results are compared with the commercial dynamic building simulation software TRNSYS. The influence of the availability and quality of data input regarding the geometrical building parameters on the accuracy of simulation models are analysed. Different Levels of Details (LoDs) of the 3D building models are tested to prove the scalability of SimStadt from single buildings to city districts without loss of quality and accuracy in larger areas with a short computational time. Keywords:
Nouvel, Romain; Zirak, Maryam; Coors, Volker; Eicker, Ursula The influence of data quality on urban heating demand modeling using 3D city models in Computers, Environment and Urban Systems
Abstract: 3D city models are rich data sets for urban energy analyses, providing geometrical and semantic data required to estimate the energy demand of entire districts, cities and even regions. However, given the diverse availability, uncertainty and Level of Details of these data and the resources required to collect them, managing data quality is a common challenge of urban energy modeling. Knowing the influences of the different input data for different configurations and applications enables to control the result accuracy and recommend intelligent and adequate data collecting strategies, by assigning resources on the most important parameters. This paper investigates the influences of geometrical, meteorological, semantic and occupancy related data quality on the heating demand estimated by the urban energy simulation platform SimStadt, applied to the City of Ludwigsburg in Germany. A focus on a district with consumption data available at building block level allows for a critical comparison be- tween estimated and measured energy demands. Although the quantified information presented in this paper is specific to a case study, the main trends and developed methods are transferable to other urban energy analysis studies based on 3D city models.
Romero Rodriguez, Laura; Nouvel, Romain; Duminil, Eric; Eicker, Ursula Setting intelligent city tiling strategies for urban shading simulations in Solar Energy 157
Abstract: Assessing accurately the solar potential of all building surfaces in cities, including shading and multiple reflections between buildings, is essential for urban energy modelling. However, since the number of surface interactions and radiation exchanges increase exponentially with the scale of the district, innovative computational strategies are needed, some of which will be introduced in the present work. They should hold the best compromise between result accuracy and computational efficiency, i.e. computational time and memory requirements.
In this study, different approaches that may be used for the computation of urban solar irradiance in large areas are presented. Two concrete urban case studies of different densities have been used to compare and evaluate three different methods: the Perez Sky model, the Simplified Radiosity Algorithm and a new scene tiling method implemented in our urban simulation platform SimStadt, used for feasible estimations on a large scale. To quantify the influence of shading, the new concept of Urban Shading Ratio has been introduced and used for this evaluation process. In high density urban areas, this index may reach 60% for facades and 25% for roofs. Tiles of 500 m width and 200 m overlap are a minimum requirement in this case to compute solar irradiance with an acceptable accuracy. In medium density areas, tiles of 300 m width and 100 m overlap meet perfectly the accuracy requirements. In addition, the solar potential for various solar energy thresholds as well as the monthly variation of the Urban Shading Ratio have been quantified for both case studies, distinguishing between roofs and facades of different orientations.
Romero Rodriguez, Laura; Duminil, Eric; Sanchez Ramos, Jose; Eicker, Ursula Assessment of the photovoltaic potential at urban level based on 3D city models: A case study and new methodological approach in Solar Energy 146
Abstract: The use of 3D city models combined with simulation functionalities allows to quantify energy demand and renewable generation for a very large set of buildings. The scope of this paper is to determine the solar photovoltaic potential at an urban and regional scale using CityGML geometry descriptions of every building. An innovative urban simulation platform is used to calculate the PV potential of the Ludwigsburg County in south-west Germany, in which every building was simulated by using 3D city models.
Both technical and economic potential (considering roof area and insolation thresholds) are investigated, as well as two different PV efficiency scenarios. In this way, it was possible to determine the fraction of the electricity demand that can be covered in each municipality and the whole region, deciding the best strategy, the profitability of the investments and determining optimal locations. Additionally, another important contribution is a literature review regarding the different methods of PV potential estimation and the available roof area reduction coefficients. An economic analysis and emission assessment has also been developed.
The results of the study show that it is possible to achieve high annual rates of covered electricity demand in several municipalities for some of the considered scenarios, reaching even more than 100% in some cases. The use of all available roof space (technical potential) could cover 77% of the region’s electricity consumption and 56% as an economic potential with only high irradiance roofs considered. The proposed methodological approach should contribute valuably in helping policy-making processes and communicating the advantages of distributed generation and PV systems in buildings to regulators, researchers and the general public.
Weiler, Verena; Harter, Hannes; Eicker, Ursula Life cycle assessment of buildings and city quarters comparing demolition and reconstruction with refurbishment in Energy and Buildings
Abstract: In the building sector, the energy and the greenhouse gases embodied in the building materials are becoming increasingly important. Combined with the operational primary energy demand and the end-of-life, the whole life cycle of buildings can be assessed. In this paper, a comprehensive method for calculating the life cycle of individual buildings is presented. First, their material composition has been determined and generic values for the embodied energy, embodied greenhouse gases, energy needed and greenhouse gases emitted during disposal of the different building materials have been calculated. Subsequently these values have been integrated into an urban energy simulation software to simulate energy and emission values for buildings. A given building geometry with four different building standards was considered. The results can help to decide between building refurbishment or demolition and new construction. For example it could be shown that the share of the life cycle stage production compared to the total value rises with a better building insulation standard, as the share of the use stage decreases. The highest building refurbishment standard resulted in the best life cycle performance when compared with less ambitious refurbishment or construction of a new building of today's standards.
2016
Parag Wate, Preston Rodrigues, Eric Duminil, and Volker Coors. Urban energy simulation based on 3D city models: a service-oriented approach. In ISPRS Annals of Photogrammetry, Remote Sensing and Spatial Information Sciences, vol. 4, pp. 75-80. Copernicus GmbH, 2016
Abstract: Recent advancements in technology has led to the development of sophisticated software tools revitalizing growth in different domains. Taking advantage of this trend, urban energy domain have developed several compute intensive physical and data driven models. These models are used in various distinct simulation softwares to simulate the whole life-cycle of energy flow in cities from supply, distribution, conversion, storage and consumption. Since some simulation software target a specific energy system, it is necessary to integrate them to predict present and future urban energy needs. However, a key drawback is that, these tools are not compatible with each other as they use custom or propriety formats. Furthermore, they are designed as desktop applications and cannot be easily integrated with third-party tools (open source or commercial). Thereby, missing out on potential model functionalities which are required for sustainable urban energy management. In this paper, we propose a solution based on Service Oriented Architecture (SOA). Our approach relies on open interfaces to offer flexible integration of modelling and computational functionality as loosely coupled distributed services.
2015
Monsalvete, Pilar; Robinson, Darren; Eicker, Ursula Dynamic simulation methodologies for urban energy demand at 6th International Building Physics Conference, IBPC 2015
Abstract: This paper presents a new dynamic physical energy model of building for simulating the energy demand of cities. Firstly, a justification it is given regarding the necessity of a new building model and the advantages of using modular building simulation when dealing with large numbers of buildings in an urban context. The main motivation was a flexible and very modular interaction of 3D urban geometry description with the CityGML data format and energy related attributes for building parts. The paper then presents the modular dynamic building model and its validation with a real case of study for single buildings. The model integration into an urban modeling platform named SimStadt is explained with the necessary input data for a city heat demand calculation
Nouvel, Romain; Brassel, Kai-Holger; Bruse, Marcel; Duminil, Eric; Coors, Volker; Eicker, Ursula; Robinson, Darren SimStadt, a new workflow-driven urban energy simulation platform for CityGML models at CISBAT 2015
Abstract: In this paper, we introduce new urban energy simulation platform SimStadt, which has been developed to support public authorities and engineering companies in the planning of the energy transition at urban scale. SimStadt design is marked by two particular features: 1- it is based on the open 3D city model CityGML and, 2- its workflow-driven structure is highly modular and extensible. These particularities allow him for a potentially unlimited variety of urban analysis, benefiting from the big geo data possibilities. This first version contains the workflows Solar and PV potential analysis, Energy demand and CO2 emission calculation, and refurbishment scenarios generation and simulation. Other workflows and plug-ins are under way, in particular district network design and simulation. This paper details these features and workflows, and presents an application on the administrative district of Ludwigsburg, a case study of half a million inhabitants spread over 34 municipalities
Stzalka, Aneta; Monien, Dirk; Koukofikis, Athanasios; Eicker, Ursula Sensitivity analysis for minimization of input data for urban scale heat demand forecasting at 14th International Conference on Sustainable Energy Technologies - SET 2015
Abstract: In the paper a methodology based on 3D building and city models is presented to calculate urban heat demand for different refurbishment scenarios. This methodology is validated on six case study buildings of the City of Essen in Germany. The influences of the availability and quality of data input regarding the geometrical and physical parameters on the accuracy of simulation models are analysed. Different CityGML Levels of Details (LoDs) of the building models as well as different sources of the physical parameters are tested in order to investigate the uncertainty of the methods used. In the first step, a semi-automated method with data pre-processing (FME software) as well as simulation of the heat demand (INSEL8 software) are used. The results are compared with a fully-automated method implemented in the urban simulation platform SimStadt, whose development is ongoing in the project with the same name (www.simstadt.eu). This platform has a special module integrated, which allows an automatic data pre- processing. Both methods calculate heat demand based on monthly energy balance (standardised in Germany with the DIN V 18599, or in Europe with the ISO 13790). The calculation of the heat demand with different accuracy of the data input enables to make a statement about which parameters have the most influence on the results. Considering the difficulties in obtaining data available at a city scale this information is very useful for future reductions of the effort of data capturing. For example, the analysis showed that the geometrical Level of Detail can give up to 12% of error depending which of the LoDs are available for the analysed building. In the next stage, the methods tested first on the six case study buildings can be extrapolated for the whole City of Essen. This methodology could be even extended to other cities on condition that they have 3D city models available.
Wate, Parag and Coors, Volker: 3D Data Models for Urban Energy Simulation at 6th International Building Physics Conference, IBPC 2015
Abstract: Sustainable use and management of energy resources is a challenging task for growing urban population. Especially, an urban environment in temperate continental climate consumes high energy resources for their space heating and domestic hot water demands. Assessment of thermal energy requirements for future energy demands is fundamental to sustainable urban environment. Thermal energy demand can be simulated using physical and empirical laws from building physics domain. Physical laws compute thermal energy consumption based on heterogeneous datasets from various data sources. These datasets may include information from cadastre, building registers, inhabitant census, 3D building models, ground surveys and meteorological databases. Furthermore, depending upon availability, accessibility and level of detail, specific simulation methods are usually employed for evaluation of energy consumption at different spatial scales. This paper attempts to identify input data parameters which could facilitate validation and calibration of thermal energy demand based on input data sensitivity using simulation methods.
2014
Nouvel, Romain; Zirak, Maryam; Dastageeri, Habiburrahman; Coors, Volker; Eicker, Ursula Urban energy analysis based on 3D city model for national scale applications at IBPSA Germany Conference Aachen
Abstract: In this paper, we present a methodology based on 3D city model to manage a realistic energy analysis of the building stock, building per building, at a very large scale (national application for instance). This methodology is tested on the City of Ludwigsburg and its more than 14.000 buildings. The influences of the data availability and quality on the model accuracy is analysed, for both geometrical and semantical information data. This paper is ended up by exposing some technological trends and policy needs to improve the realism and potentials of this methodology
2013
Eicker, Ursula; Nouvel, Romain; Duminil, Eric; Coors, Volker Assessing passive and active solar energy resources in cities using 3D city models at 2013 ISES Solar World Congress
Abstract: Many cities today are committed to increasing the energy efficiency of buildings and the fraction of renewables. However, quantitative data on urban energy performance are rarely available during the design stage of new towns or for rehabilitation scenarios of existing cities. Three dimensional city models based on the spatio-semantic data format CityGML offer powerful new methods for the quantitative evaluation of urban energy demand and costs, and simultaneously allow the simulation of renewable energy systems. Such a ‘semantically enriched’ models was used in this work for energy demand diagnostics, refurbishment forecast and renewable supply scenarios. A case study was done using this method in an existing urban quarter in Ludwigsburg/Germany. Based on its three dimensional representation, the photovoltaic potential has been calculated and compared with the electricity demand to establish the photovoltaic fraction. On the thermal side, the passive solar gains were simulated for each building in the city quarter to analyse the solar contribution for heating demand reduction. The simulations were validated with measured gas consumptions. Some rehabilitation scenarios have also been simulated. In such a moderately dense post-war district, the calculated energy savings potential reach in total 65%, equally distributed between heat savings following building envelope refurbishment, and electricity savings due to the installation of PV on the roofs.
2012
Strzalka, Aneta; Alam, Nazmul; Duminil, Eric; Coors, Volker; Eicker, Ursula Large scale integration of photovoltaics in cities in Applied Energy
Abstract: For a large scale implementation of photovoltaics (PV) in the urban environment, building integration is a major issue. This includes installations on roof or facade surfaces with orientations that are not ideal for maximum energy production. To evaluate the performance of PV systems in urban settings and compare it with the building user’s electricity consumption, three-dimensional geometry modelling was combined with photovoltaic system simulations. As an example, the modern residential district of Scharnhauser Park (SHP) near Stuttgart/Germany was used to calculate the potential of photovoltaic energy and to eval- uate the local own consumption of the energy produced. For most buildings of the district only annual electrical consumption data was available and only selected buildings have electronic metering equipment. The available roof area for one of these multi- family case study buildings was used for a detailed hourly simulation of the PV power production, which was then compared to the hourly measured electricity consumption. The results were extrapolated to all buildings of the analyzed area by normalizing them to the annual consumption data. The PV systems can produce 35% of the quarter’s total electricity consumption and half of this generated electricity is directly used within the buildings.
Acknowledgements
Project Partners
- Zafh.net - HfT Stuttgart
- ZGG - HfT Stuttgart
- M.O.S.S.
- GEF Ingenieur AG
- Mainzer Stadtwerke
- Stadtwerke Stuttgart
Project Management Jülich (PTJ)
BMWi
Federal Ministry of Economics and Technology
Das SimStadt 2.0-Projekt wird unter dem Förderkennzeichen 03ET1459A vom Bundesministerium für Wirtschaft und Energie (BMWi) gefördert.

Contact
HfT Stuttgart
Schellingstraße 24
70174 Stuttgart
Germany
Privacy policy
https://www.hft-stuttgart.com/privacy
Imprint
Ended: About
Workflows ↵
Biomass Analysis
Goal
Calculates the potential of biomass
Workflowsteps
District Heating Network Analysis
Goal
Generates a possible District Heating Network layout (as a minimum spanning tree) and sizes it with a very rough estimate, based on the building heat demands and street layout.
Workflowsteps
Dynamic Template
Goal
For testing purposes. Allows to write and run models from templates, e.g. with INSEL.
Workflowsteps
Empty
Goal
After enabling User-Settings > Show "Add Step" button, it is possible to create workflows by appending workflowsteps one after the other, starting with ImportCityGml.
Workflowsteps
Environmental Analysis With Refurbishment Strategy
Goal
Calculation of the primary energy and CO2 emissions related to the space heating and domestic hot water demands, with consideration of a refurbishment strategy
Workflowsteps
Environmental Analysis
Goal
Calculation of the primary energy and CO2 emissions related to the space heating and domestic hot water demands.
Workflowsteps
Heat Demand Analysis With Energy ADEWriter
Goal
Calculation of the yearly space heating and domestic hot water demands, based on DIN V 18599. Results are written to a CityGML file + Energy ADE.
Workflowsteps
Heat Demand Analysis With Refurbishment Strategy
Goal
Calculation of the yearly space heating and domestic hot water demands, based on DIN V 18599, with consideration of a refurbishment strategy.
Workflowsteps
Heat Demand Analysis
Goal
Calculation of the yearly space heating and domestic hot water demands, based on DIN V 18599.
Workflowsteps
Hourly Heat Demand Analysis With Energy System
Goal
Calculation of the yearly space heating and domestic hot water demands, based on DIN V 18599, with INSEL energy system templates.
Workflowsteps
Hourly Heat Demand Analysis
Goal
Calculation of the space heating hourly demand, based on DIN V 18599 + VDI 4710.
Workflowsteps
Load Profile
Goal
Generates a random but possibly realistic electrical load profile for each residential building, using an autoregressive stochastic model based on measured data.
Workflowsteps
Photovoltaic Potential Analysis
Goal
Calculation of the potential of photovoltaic electricity production, for different PV installation configurations.
Workflowsteps
Photovoltaic Potential Financial Analysis
Goal
Calculation of the potential of photovoltaic electricity production, for different PV installation configurations. Including financial analysis.
Workflowsteps
Solar Potential Analysis
Goal
Calculates global solar irradiance on every surface, and displays yearly average in a 3D render. Useful to check geometry, location and weather data.
Workflowsteps
Water Food Demand Analysis
Goal
Calculates the water and food demand of buildings and land fields
Workflowsteps
Ended: Workflows
Workflowsteps ↵
Biomass Processor
Goal
Experimental workflowstep, designed to estimate the biomass potential of a region.
Technical information
| Class | BiomassProcessor |
| Superclass | WorkflowStep |
| Author | |
| Maintainer | |
| Source location | simstadt-workflows-energy/src/main/java/de/hftstuttgart/simstadtworkflowsteps/biomass/BiomassProcessor.java |
| Package | de.hftstuttgart.simstadtworkflowsteps.biomass |
| Project | simstadt-workflows-energy |
Dependencies
Parameters
Country (country)
Country in which the model is located.
- Type :
Country - Default :
GERMANY - Possible values :
GERMANY, FRANCE_LAREUNION, AUSTRIA_VIENNA - Getter :
getCountry() - Setter :
setCountry(Country)
Forest harvest percentage (forestCuttingDownPercentage)
How much wood is cut down during harvest.
- Type :
double -
Default :
3.0 -
Unit :
[%] - Getter :
getForestCuttingDownPercentage() - Setter :
setForestCuttingDownPercentage(double)
Forest energy use percentage (forestEnergyUsePercentage)
After harvest, how much of the cut wood is used for energy.
- Type :
double -
Default :
25.6 -
Unit :
[%] - Getter :
getForestEnergyUsePercentage() - Setter :
setForestEnergyUsePercentage(double)
Solid fuel for energy percentage (residueEnergyUsePercentage)
How much waste solid fuels are used for energy purpose.
- Type :
double -
Default :
62.0 -
Unit :
[%] - Getter :
getResidueEnergyUsePercentage() - Setter :
setResidueEnergyUsePercentage(double)
Maize residue for biogas percentage (maizResidueForBiogasPercentage)
How much maize residue is used for biogas production, the rest is used as solid fuel.
- Type :
double -
Default :
39.4 -
Unit :
[%] - Getter :
getMaizResidueForBiogasPercentage() - Setter :
setMaizResidueForBiogasPercentage(double)
Energy plant percentage (energyPlantAreaPercentage)
How much crop of the land is grown as energy crop.
- Type :
double -
Default :
14.0 -
Unit :
[%] - Getter :
getEnergyPlantAreaPercentage() - Setter :
setEnergyPlantAreaPercentage(double)
Grass and grove for energy percentage (grassAndgroveEnergyPercentage)
How much crop of grass land and grove is used for energy purpose.
- Type :
double -
Default :
5.0 -
Unit :
[%] - Getter :
getGrassAndgroveEnergyPercentage() - Setter :
setGrassAndgroveEnergyPercentage(double)
Config filename (configFile)
Filename of config file, describing yields and water consumption of different vegetation.
Can be in repository, project or workflowstep folder.
- Type :
String - Default :
biomassconfig.xml - Getter :
getConfigFile() - Setter :
setConfigFile(String)
Used in
City Gml Writer
Goal
Writes back the CityGML file, after adding some attributes:
- measured height
- storeys above ground
- year of construction
- heated floor area (as EnergyADE attribute)
- monthly space heating demand (as EnergyADE attribute)
- yearly domestic hot water demand
Technical information
| Class | CityGmlWriter |
| Superclass | WorkflowStep |
| Author | |
| Maintainer | |
| Source location | simstadt/src/main/java/eu/simstadt/workflowsteps/CityGmlWriter.java |
| Package | eu.simstadt.workflowsteps |
| Project | simstadt |
Dependencies
- Create SimStadt Model
- Geometric Preprocessor
- Import City Gml
- Irradiance Processor
- Monthly Energy Balance
- Physics Preprocessor
- Usage Preprocessor
- Weather Processor
Parameters
Used in
Create SimStadt Model
Goal
- Creates a SimStadtModel with its SimStadtBuildings, from a CityDoctorModel
- SimStadtBuildings are created with many placeholders for attributes which will be calculated and needed in the following steps, e.g. Usage Zones, PhysicsProperties, SpatialProperties, ...
Technical information
| Class | CreateSimStadtModel |
| Superclass | WorkflowStep |
| Author | |
| Maintainer | |
| Source location | simstadt/src/main/java/eu/simstadt/workflowsteps/CreateSimStadtModel.java |
| Package | eu.simstadt.workflowsteps |
| Project | simstadt |
Dependencies
Parameters
Assignment Strategy (assignmentStrategy)
PreferBuildingPartsOverBuilding: If a building consists of building parts, the building itself and each part are converted to separate SimStadtBuildings.
JustTheBuildings: Only the buildings are converted to SimStadtBuildings. Building parts are ignored.
- Type :
Strategy - Default :
PreferBuildingPartsOverBuilding - Possible values :
PreferBuildingPartsOverBuilding, JustTheBuildings - Getter :
getAssignmentStrategy() - Setter :
setAssignmentStrategy(Strategy)
Used in
- Biomass Analysis
- District Heating Network Analysis
- Dynamic Template
- Environmental Analysis
- Environmental Analysis With Refurbishment Strategy
- Heat Demand Analysis
- Heat Demand Analysis With Energy ADEWriter
- Heat Demand Analysis With Refurbishment Strategy
- Hourly Heat Demand Analysis
- Hourly Heat Demand Analysis With Energy System
- Load Profile
- Photovoltaic Potential Analysis
- Photovoltaic Potential Financial Analysis
- Solar Potential Analysis
- Water Food Demand Analysis
Crop Yield Simulator
Goal
Experimental workflow to calculate yield and water demand with Aquacrop.exe, for Biomass potential.
Technical information
| Class | CropYieldSimulator |
| Superclass | WorkflowStep |
| Author | |
| Maintainer | |
| Source location | simstadt-workflows-energy/src/main/java/de/hftstuttgart/simstadtworkflowsteps/biomass/CropYieldSimulator.java |
| Package | de.hftstuttgart.simstadtworkflowsteps.biomass |
| Project | simstadt-workflows-energy |
Dependencies
Parameters
Calculation method (yieldCalculationMethod)
Skip, or run AquaCrop program.
- Type :
YieldCalculationMethod - Default :
SKIP - Possible values :
SKIP, AQUACROP - Getter :
getYieldCalculationMethod() - Setter :
setYieldCalculationMethod(YieldCalculationMethod)
Aquacrop folder (aquacropFolder)
Path to folder containing aquacrop program (ACsaV60.exe).
- Type :
String - Default :
C:\Program Files\AquaCrop - Getter :
getAquacropFolder() - Setter :
setAquacropFolder(String)
Country / Location (country)
- Type :
Country - Default :
GERMANY - Possible values :
GERMANY, FRANCE_LAREUNION, AUSTRIA_VIENNA - Getter :
getCountry() - Setter :
setCountry(Country)
Crop irrigation type (cropIrrigationType)
?
- Type :
CropIrrigationType - Default :
NONE - Possible values :
EXAMPLE, IGEN, INET, TR2A, TR2BFIX, NONE, NI10, NI20, NI30, NI40, NI50, NI60, NI70, NI80, NI90, NI92, NI94, NI96, NI98 - Getter :
getCropIrrigationType() - Setter :
setCropIrrigationType(CropIrrigationType)
Crop management type (cropManagementType)
?
- Type :
CropManagementType - Default :
NONE - Possible values :
BUNDS, MULCH, WEEDS, MODERATE_SF, NONE - Getter :
getCropManagementType() - Setter :
setCropManagementType(CropManagementType)
Used in
District Heating Generator
Goal
Generates a possible District Heating Network layout (as a minimum spanning tree) and sizes it with a very rough estimate, based on the building heat demands and street layout.
- This step needs a SimStadtModel as input, coming from MonthlyEnergyBalance.
- There should be at least one building with a heating demand.
- The output is a minimum spanning tree, connecting all the buildings with a positive heating demand to a power plant, located at the center of the model (or at the desired location if defined).
- The tree is available as a PNG diagram and a STANET model in CSV format.
- If desired, a basic STANET simulation can be launched with the CSV file.
Technical information
| Class | DistrictHeatingGenerator |
| Superclass | WorkflowStep |
| Author | |
| Maintainer | |
| Source location | simstadt-workflows-energy/src/main/java/de/hftstuttgart/simstadtworkflowsteps/energy/DistrictHeatingGenerator.java |
| Package | de.hftstuttgart.simstadtworkflowsteps.energy |
| Project | simstadt-workflows-energy |
Dependencies
- Create SimStadt Model
- Geometric Preprocessor
- Import City Gml
- Irradiance Processor
- Monthly Energy Balance
- Physics Preprocessor
- Usage Preprocessor
- Weather Processor
Parameters
Pipe cost: Along road (pipeCostAlongRoad)
Specific cost per distance of a pipe, when installed along a road.
If this kind of pipes is preferred, their cost should be lower compared to the others.
This value is used as an edge weight in graph algorithms
The absolute value is not relevant, only the relative value compared to pipeCostNotAlongRoad and pipeCostCrossingBuilding will have an influence on the layout.
At the time of the graph creation, the pipe diameter is not yet known, so it cannot be taken into account into the specific cost.
- Type :
Float -
Default :
1.0 -
Unit :
[1/m] - Getter :
getPipeCostAlongRoad() - Setter :
setPipeCostAlongRoad(Float)
Pipe cost: Not along road (pipeCostNotAlongRoad)
Specific cost per distance of a pipe, when installed away from a road.
This value is used as an edge weight in graph algorithms
The absolute value is not relevant, only the relative value compared to pipeCostAlongRoad and pipeCostCrossingBuilding will have an influence on the layout.
At the time of the graph creation, the pipe diameter is not yet known, so it cannot be taken into account into the specific cost.
- Type :
Float -
Default :
3.0 -
Unit :
[1/m] - Getter :
getPipeCostNotAlongRoad() - Setter :
setPipeCostNotAlongRoad(Float)
Pipe cost: Crossing building (pipeCostCrossingBuilding)
Specific cost per distance of a pipe, when installed through a building.
This kind of pipes should be avoided, so their cost should be high compared to the others.
This value is used as an edge weight in graph algorithms
The absolute value is not relevant, only the relative value compared to pipeCostAlongRoad and pipeCostNotAlongRoad will have an influence on the layout.
At the time of the graph creation, the pipe diameter is not yet known, so it cannot be taken into account into the specific cost.
- Type :
Float -
Default :
1000.0 -
Unit :
[1/m] - Getter :
getPipeCostCrossingBuilding() - Setter :
setPipeCostCrossingBuilding(Float)
Full load hours (fullLoadHours)
In order to design the district heating network and to calculate pipe dimensions, the nominal power of each sub-station should be known.
Monthly energy balance only outputs the average heat demand but does not calculate the required nominal power of heating systems.
In order to convert kWh/a to kW, full load hours must be known :
How many hours the heating system would have taken to cover the required heat demand had it been operating at full capacity (maximum power output) for that time?
A typical value is 2000h/a, which means the heating system would work approximately 23% of the time, and a 10kWp sub-station would be enough to cover a heat demand of 20 000kWh/a.
- Type :
Integer -
Default :
2000 -
Unit :
[h/a] - Getter :
getFullLoadHours() - Setter :
setFullLoadHours(Integer)
Supply pressure (supplyPressure)
Supply pressure.
This parameter is not used for district heating layout, but is forwarded as an input to STANET.
- Type :
Float -
Default :
6.0 -
Unit :
[bar] - Getter :
getSupplyPressure() - Setter :
setSupplyPressure(Float)
Return pressure (returnPressure)
Return pressure.
This parameter is not used for district heating layout, but is forwarded as an input to STANET.
- Type :
Float -
Default :
2.0 -
Unit :
[bar] - Getter :
getReturnPressure() - Setter :
setReturnPressure(Float)
Supply temperature (supplyTemperature)
Supply temperature.
This parameter is not used for district heating layout, but is forwarded as an input to STANET.
- Type :
Integer -
Default :
90 -
Unit :
[°C] - Getter :
getSupplyTemperature() - Setter :
setSupplyTemperature(Integer)
Return temperature (returnTemperature)
Return temperature.
This parameter is not used for district heating layout, but is forwarded as an input to STANET.
- Type :
Integer -
Default :
55 -
Unit :
[°C] - Getter :
getReturnTemperature() - Setter :
setReturnTemperature(Integer)
Power plant longitude (powerPlantLongitude)
If latitude and longitude are specified, the power plant (the root of the spanning tree) will be placed at the desired location.
If this parameter is left blank, the power plant will be placed in the middle of the 3D model.
East is positive, West is negative.
Example: 9.179749 (for Stuttgart)
- Type :
String -
Default :
undefined -
Unit :
[°] - Getter :
getPowerPlantLongitude() - Setter :
setPowerPlantLongitude(String)
Power plant latitude (powerPlantLatitude)
If latitude and longitude are specified, the power plant (the root of the spanning tree) will be placed at the desired location.
If this parameter is left blank, the power plant will be placed in the middle of the 3D model.
North is positive, South is negative.
Example: 48.7786 (for Stuttgart)
- Type :
String -
Default :
undefined -
Unit :
[°] - Getter :
getPowerPlantLatitude() - Setter :
setPowerPlantLatitude(String)
With STANET simulation? (withStanetSimulation)
Should STANET be automatically started at the end of the workflow?
If enabled, and if STANET is installed:
* STANET will be started

* CSV file will be imported

* resulting STANET files will be saved

* Basic simulation will be started

* Results will be displayed in the log console.
- Type :
boolean - Default :
false - Getter :
isWithStanetSimulation() - Setter :
setWithStanetSimulation(boolean)
Used in
Dynamic Template
Goal
Proof of concept for dynamic templates, writing INSEL models and using information from an energy component library. One template will be written for each building.
Technical information
| Class | DynamicTemplate |
| Superclass | WorkflowStep |
| Author | |
| Maintainer | |
| Source location | simstadt-workflows-energy/src/main/java/de/hftstuttgart/simstadtworkflowsteps/template/DynamicTemplate.java |
| Package | de.hftstuttgart.simstadtworkflowsteps.template |
| Project | simstadt-workflows-energy |
Dependencies
Parameters
Template name (templateName)
Filename ('example.hbs') or basename ('example') of Handlebars template.
The corresponding file should be in the current project or workflowstep folder.
Leave this parameter empty in order to write an example template file.
- Type :
String - Default : ``
- Getter :
getTemplateName() - Setter :
setTemplateName(String)
Energy components catalog filename (energyComponentsCatalogFilename)
Filename of energy components catalog.
The corresponding file should be in the current project or workflowstep folder.
- Type :
String -
Default :
Catalog.encomp -
Unit :
[.encomp] - Getter :
getEnergyComponentsCatalogFilename() - Setter :
setEnergyComponentsCatalogFilename(String)
Output filename (outputFilename)
For each building, one output file will be written.
A custom filename can be specified with variables: '{{model.name}}-{{building.gmlId}}-{{template}}.insel'
Which would compile to "20140218_Gruenbuehl_LOD2_2buildings-DEBW_LOD2_1007720-test_template.insel"
- Type :
String - Default :
{{model.name}}-{{building.gmlId}}-{{template}} - Getter :
getOutputFilename() - Setter :
setOutputFilename(String)
Launch INSEL (runInsel)
Run INSEL on the compiled model, for each building.
- Type :
boolean - Default :
false - Getter :
isRunInsel() - Setter :
setRunInsel(boolean)
Used in
Energy System Template
Goal
Proof of concept for dynamic templates, writing INSEL models and using information from an energy component library. One template will be written for each building. These templates are specially defined for energy systems, and should come after hourly heat demand.
Technical information
| Class | EnergySystemTemplate |
| Superclass | DynamicTemplate |
| Author | |
| Maintainer | |
| Source location | simstadt-workflows-energy/src/main/java/de/hftstuttgart/simstadtworkflowsteps/template/EnergySystemTemplate.java |
| Package | de.hftstuttgart.simstadtworkflowsteps.template |
| Project | simstadt-workflows-energy |
Dependencies
- Create SimStadt Model
- Geometric Preprocessor
- Hourly Heat Demand
- Import City Gml
- Irradiance Processor
- Monthly Energy Balance
- Physics Preprocessor
- Usage Preprocessor
- Weather Processor
Parameters
Energy system (systemType)
Which energy system should be used? (e.g. Heat pump & Gas boiler). It will influence both templates and the dynamic variables.
Only one system has been defined so far.
- Type :
SystemType - Default :
HEAT_PUMP_AND_BOILER - Possible values :
HEAT_PUMP_AND_BOILER, CHP_AND_BOILER, CHP_AND_HEAT_PUMP - Getter :
getSystemType() - Setter :
setSystemType(SystemType)
Template name (templateName)
Filename ('example.hbs') or basename ('example') of Handlebars template.
The corresponding file should be in the current project or workflowstep folder.
Leave this parameter empty in order to write an example template file.
- Type :
String - Default : ``
- Getter :
getTemplateName() - Setter :
setTemplateName(String)
Energy components catalog filename (energyComponentsCatalogFilename)
Filename of energy components catalog.
The corresponding file should be in the current project or workflowstep folder.
- Type :
String -
Default :
Catalog.encomp -
Unit :
[.encomp] - Getter :
getEnergyComponentsCatalogFilename() - Setter :
setEnergyComponentsCatalogFilename(String)
Output filename (outputFilename)
For each building, one output file will be written.
A custom filename can be specified with variables: '{{model.name}}-{{building.gmlId}}-{{template}}.insel'
Which would compile to "20140218_Gruenbuehl_LOD2_2buildings-DEBW_LOD2_1007720-test_template.insel"
- Type :
String - Default :
{{model.name}}-{{building.gmlId}}-{{template}} - Getter :
getOutputFilename() - Setter :
setOutputFilename(String)
Supply temperature (supplyTemperature)
Supply temperature for energy system
- Type :
int -
Default :
60 -
Unit :
[°C] - Getter :
getSupplyTemperature() - Setter :
setSupplyTemperature(int)
Return temperature (returnTemperature)
Return temperature for energy system
- Type :
int -
Default :
35 -
Unit :
[°C] - Getter :
getReturnTemperature() - Setter :
setReturnTemperature(int)
Peak load percentage (peakLoadPercentage)
The system is based on two components (e.g. Heat pump & gas boiler). Which percentage of the peak load should be covered by the primary component? (e.g. 70%)
The secondary component will cover the rest (e.g. 30%).
- Type :
int -
Default :
100 -
Unit :
[%] - Getter :
getPeakLoadPercentage() - Setter :
setPeakLoadPercentage(int)
Water tank buffer duration (waterTankBufferDuration)
How long should the water tank be able to cover the average load?
- Type :
int -
Default :
3 -
Unit :
[h] - Getter :
getWaterTankBufferDuration() - Setter :
setWaterTankBufferDuration(int)
Launch INSEL (runInsel)
Run INSEL on the compiled model, for each building.
- Type :
boolean - Default :
false - Getter :
isRunInsel() - Setter :
setRunInsel(boolean)
Used in
Geometric Preprocessor
Goal
- Analyzes complete geometry of the model
- Calculates building coordinates
- Finds neighbors for each building
- Detects if a surface is a roof, a wall or a ground surface (if not yet defined)
- Detects if a wall is exterior or a shared wall
- Calculates building height
- Calculates building volume
- Checks if building volume looks reasonable
Technical information
| Class | GeometricPreprocessor |
| Superclass | WorkflowStepWithSimStadtGraphics |
| Author | |
| Maintainer | |
| Source location | simstadt/src/main/java/eu/simstadt/workflowsteps/GeometricPreprocessor.java |
| Package | eu.simstadt.workflowsteps |
| Project | simstadt |
Dependencies
Parameters
Used in
- District Heating Network Analysis
- Dynamic Template
- Environmental Analysis
- Environmental Analysis With Refurbishment Strategy
- Heat Demand Analysis
- Heat Demand Analysis With Energy ADEWriter
- Heat Demand Analysis With Refurbishment Strategy
- Hourly Heat Demand Analysis
- Hourly Heat Demand Analysis With Energy System
- Load Profile
- Photovoltaic Potential Analysis
- Photovoltaic Potential Financial Analysis
- Solar Potential Analysis
- Water Food Demand Analysis
Hourly Heat Demand
Goal
Applies VDI 4710 with DegreeDays method in order to estimate an hourly profile of space heating demand.
Technical information
| Class | HourlyHeatDemand |
| Superclass | WorkflowStepWithSimStadtGraphics |
| Author | |
| Maintainer | |
| Source location | simstadt-workflows-energy/src/main/java/de/hftstuttgart/simstadtworkflowsteps/energy/HourlyHeatDemand.java |
| Package | de.hftstuttgart.simstadtworkflowsteps.energy |
| Project | simstadt-workflows-energy |
Dependencies
- Create SimStadt Model
- Geometric Preprocessor
- Import City Gml
- Irradiance Processor
- Monthly Energy Balance
- Physics Preprocessor
- Usage Preprocessor
- Weather Processor
Parameters
Write one file per building? (oneFilePerBuilding)
If desired, one result file can be written for each simulated building.
It includes:
* "Hour of the Year"

* Hourly demand

* Load duration curve
Those file can be used in further processing, e.g. with INSEL.
- Type :
boolean - Default :
false - Getter :
isOneFilePerBuilding() - Setter :
setOneFilePerBuilding(boolean)
Used in
Import City Gml
Goal
Loads a LOD1 or LOD2 CityGML file as a CityDoctor model, for further processing.
Technical information
| Class | ImportCityGml |
| Superclass | WorkflowStep |
| Author | |
| Maintainer | |
| Source location | simstadt/src/main/java/eu/simstadt/citygml/steps/ImportCityGml.java |
| Package | eu.simstadt.citygml.steps |
| Project | simstadt |
Dependencies
Parameters
Minimal LOD (minimalLod)
Lowest Level of Detail which should be imported.
Choosing LOD2 will force SimStadt to only import LOD2 buildings (if present).
- Type :
LOD - Default :
LOD1 - Possible values :
LOD1, LOD2 - Getter :
getMinimalLod() - Setter :
setMinimalLod(LOD)
Maximal LOD (maximalLod)
Highest Level of Detail which should be imported.
Choosing LOD1 will force SimStadt to only import LOD1 buildings (if present).
- Type :
LOD - Default :
LOD2 - Possible values :
LOD1, LOD2 - Getter :
getMaximalLod() - Setter :
setMaximalLod(LOD)
Validate against XML schema? (validateAgainstXMLSchema)
Checks if the imported CityGML is a correct CityGML file according to XML schema.
Will throw an error and stop processing if the file is not considered valid.
- Type :
boolean - Default :
false - Getter :
isValidateAgainstXMLSchema() - Setter :
setValidateAgainstXMLSchema(boolean)
Used in
- Biomass Analysis
- District Heating Network Analysis
- Dynamic Template
- Empty
- Environmental Analysis
- Environmental Analysis With Refurbishment Strategy
- Heat Demand Analysis
- Heat Demand Analysis With Energy ADEWriter
- Heat Demand Analysis With Refurbishment Strategy
- Hourly Heat Demand Analysis
- Hourly Heat Demand Analysis With Energy System
- Load Profile
- Photovoltaic Potential Analysis
- Photovoltaic Potential Financial Analysis
- Solar Potential Analysis
- Water Food Demand Analysis
Irradiance Processor
Goal
Calculates monthly average irradiances on every surface, with or without shadows.
Technical information
| Class | IrradianceProcessor |
| Superclass | WorkflowStepWithSimStadtGraphics |
| Author | |
| Maintainer | |
| Source location | simstadt/src/main/java/eu/simstadt/workflowsteps/IrradianceProcessor.java |
| Package | eu.simstadt.workflowsteps |
| Project | simstadt |
Dependencies
Parameters
Radiation Model (radiationModel)
Hay sky model, calculated with INSEL : fast, without shadows
Perez sky model, calculated with INSEL : fast, more detailed and possibly more accurate than Hay, without shadows
Perez sky model, calculated with Simplified Radiosity Algorithm : can be very slow, should not be used for larger models, with shadows
Perez sky model, calculated with Simplified Radiosity Algorithm on tiles : can be used for larger models (which will be split in smaller tiles), with shadows
Perez sky model, calculated with Simplified Radiosity Algorithm on a geodesic dome : fast, can be used for comparisons with other SRA calculations, without shadows
- Type :
RadiationModel - Default :
INSEL_Hay - Possible values :
INSEL_Hay, INSEL_Perez, SRA_Perez, SRA_Perez_with_tiling, SRA_Perez_without_shadows - Getter :
getRadiationModel() - Setter :
setRadiationModel(RadiationModel)
Azimuth Resolution (azimuthResolution)
For sky models calculated with INSEL : the irradiance will be calculated every N° azimuth.
- Type :
int -
Default :
5 -
Unit :
[°] - Getter :
getAzimuthResolution() - Setter :
setAzimuthResolution(int)
Tilt Resolution (tiltResolution)
For sky models calculated with INSEL : the irradiance will be calculated every N° tilt.
- Type :
int -
Default :
5 -
Unit :
[°] - Getter :
getTiltResolution() - Setter :
setTiltResolution(int)
Keep Hourly Cache File? (keepHourlyCacheFile)
SRA calculations create a large file with hourly irradiance for every surface.
Monthly averages are calculated from this hourly file.
Hourly values will be discarded unless this parameter is set to true.
- Type :
boolean - Default :
false - Getter :
getKeepHourlyCacheFile() - Setter :
setKeepHourlyCacheFile(boolean)
Tile Side Length (tileSideLength)
For SRA_Perez_with_tiling : The complete 3D model is split in smaller tiles before shadows are calculated.
Each tile is processed separately. This parameter defines the side length of those square tiles.
- Type :
int -
Default :
400 -
Unit :
[m] - Getter :
getTileSideLength() - Setter :
setTileSideLength(int)
Tile Overlap (tileOverlap)
For SRA_Perez_with_tiling : The complete 3D model is split in smaller tiles before shadows are calculated.
Each tile is processed separately. In order to consider shadows for the buildings located on the edge of the tiles, those tiles should overlap.
This parameter defines how much overlap there should be between two adjacent tiles.
- Type :
int -
Default :
100 -
Unit :
[m] - Getter :
getTileOverlap() - Setter :
setTileOverlap(int)
Used in
- District Heating Network Analysis
- Environmental Analysis
- Environmental Analysis With Refurbishment Strategy
- Heat Demand Analysis
- Heat Demand Analysis With Energy ADEWriter
- Heat Demand Analysis With Refurbishment Strategy
- Hourly Heat Demand Analysis
- Hourly Heat Demand Analysis With Energy System
- Photovoltaic Potential Analysis
- Photovoltaic Potential Financial Analysis
- Solar Potential Analysis
List Energy Systems
Goal
Called after EnergySystemTemplate, this step will write a CSV file containing a description of all the energy systems which have been chosen for each building. For example:
- Building;Main energy system;;Backup energy system;;Water tank;;Photovoltaic;;Solar battery;;;
- ID;Name;Power;Name;Power;Name;Volume;Nominal power;Yield;Name;Amp-hour;Voltage;Energy
- [-];[-];[kW];[-];[kW];[-];[m³];[kWp];[MWh/a];[-];[Ah];[V];[kWh]
- _Oberstadt4736_BD.D57nsh99VQZSKgcs2lhj;WPL 130 AC;75.6;Evolution Viso Compact;25;Oskar 10;4;;;;;;
- _Oberstadt4736_BD.nPBI5H7YyKxy3n0yiYeI;alira LW 140;14.2;atmoTECexclusive VC 104/4-7A;10;Vitocell 100-E, Typ SVPA, 400l;0.4;6;6.4;theoretical battery 2;20;400;8
- _Oberstadt4736_BD.SGXeiErb1E4FezDIQWJi;;;;;;;;;;;;
- ...
Technical information
| Class | ListEnergySystems |
| Superclass | WorkflowStep |
| Author | |
| Maintainer | |
| Source location | simstadt-workflows-energy/src/main/java/de/hftstuttgart/simstadtworkflowsteps/template/energysystem/ListEnergySystems.java |
| Package | de.hftstuttgart.simstadtworkflowsteps.template.energysystem |
| Project | simstadt-workflows-energy |
Dependencies
- Create SimStadt Model
- Energy System Template
- Geometric Preprocessor
- Hourly Heat Demand
- Import City Gml
- Irradiance Processor
- Monthly Energy Balance
- Physics Preprocessor
- Usage Preprocessor
- Weather Processor
Parameters
Used in
Load Profile Generator
Goal
Generates a random but possibly realistic electrical load profile for each residential building, using an autoregressive stochastic model based on measured data.
Technical information
| Class | LoadProfileGenerator |
| Superclass | WorkflowStepWithSimStadtGraphics |
| Author | |
| Maintainer | |
| Source location | simstadt-workflows-loadprofile/src/main/java/de/hftstuttgart/simstadtworkflowsteps/energy/LoadProfileGenerator.java |
| Package | de.hftstuttgart.simstadtworkflowsteps.energy |
| Project | simstadt-workflows-loadprofile |
Dependencies
- Create SimStadt Model
- Geometric Preprocessor
- Import City Gml
- Physics Preprocessor
- Usage Preprocessor
Parameters
From (from)
Load profile will be generated starting at this date (inclusive).
By default, it is the first day of the current year.
If a complete year is generated, a model-wide load-duration curve CSV will be exported.
- Type :
LocalDate - Default :
2022-01-01 - Getter :
getFrom() - Setter :
setFrom(LocalDate)
To (to)
Load profile will be generated until this date (inclusive).
By default, it is the last day of the current year.
If a complete year is generated, a model-wide load-duration curve CSV will be exported.
- Type :
LocalDate - Default :
2022-12-31 - Getter :
getTo() - Setter :
setTo(LocalDate)
CSV resolution (csvResolution)
Should a CSV be exported with one column per building?
If yes, with which time resolution?
- Type :
CSV_RESOLUTION - Default :
Hourly - Possible values :
No export, 15 Minutes, Hourly, Daily, Weekly, Yearly - Getter :
getCsvResolution() - Setter :
setCsvResolution(CSV_RESOLUTION)
Used in
Monthly Energy Balance
Goal
Applies a monthly energy balance to each building, in order to determine monthly heating and cooling demands. The implementation is based on the German norm "DIN V 18599". The monthly energy balance is a static thermal model, calculating the overall energy balance of buildings with a monthly resolution, based on the DIN V 18599-2. The energy balance includes all heat sources (intern gains, solar gains...) and sinks (transmission, ventilation...) within the building zone, its results are the monthly space heating and cooling demand.
Technical information
| Class | MonthlyEnergyBalance |
| Superclass | WorkflowStepWithSimStadtGraphics |
| Author | |
| Maintainer | |
| Source location | simstadt/src/main/java/eu/simstadt/workflowsteps/MonthlyEnergyBalance.java |
| Package | eu.simstadt.workflowsteps |
| Project | simstadt |
Dependencies
- Create SimStadt Model
- Geometric Preprocessor
- Import City Gml
- Irradiance Processor
- Physics Preprocessor
- Usage Preprocessor
- Weather Processor
Parameters
Calculation mode (calculationMode)
Depending on the location, it might make sense to either calculate:
Heating
Cooling
Heating and cooling
Note that monthly energy balance probably is not very accurate for cooling simulation, because short-term cooling demand peaks in the afternoon cannot be considered.
- Type :
CalculationMode - Default :
HEATING - Possible values :
HEATING, COOLING, HEATING_AND_COOLING - Getter :
getCalculationMode() - Setter :
setCalculationMode(CalculationMode)
Consumer behaviour (consumerBehaviour)
Enables to choose between different "consumer behaviour Type":
Standard (following strictly the norm)
or the user factor "IWU_Nutzung", empirically determined by IWU based on a comparison study between the norm-calculated and actual energy use.
- Type :
ConsumerBehaviourType - Default :
IWU_NUTZUNG - Possible values :
STANDARD, IWU_NUTZUNG - Getter :
getConsumerBehaviour() - Setter :
setConsumerBehaviour(ConsumerBehaviourType)
Write INSEL model? (writeInselModel)
For each simulated building, should a separate INSEL model be written?
It could be useful for debugging purposes or additional simulation.
Note that this model is not used in SimStadt and might lead to slightly different results.
- Type :
boolean - Default :
false - Getter :
isWriteInselModel() - Setter :
setWriteInselModel(boolean)
Used in
Photovoltaic Economics
Goal
Defines many financial parameters which can be used by PhotovoltaicPotential.
Technical information
| Class | PhotovoltaicEconomics |
| Superclass | WorkflowStepWithSimStadtGraphics |
| Author | |
| Maintainer | |
| Source location | simstadt/src/main/java/eu/simstadt/photovoltaic/PhotovoltaicEconomics.java |
| Package | eu.simstadt.photovoltaic |
| Project | simstadt |
Dependencies
Parameters
Nominal Power #1 (nominalPower1)
Nominal power #1 for which specific installation costs are given.
- Type :
int -
Default :
10 -
Unit :
[kWp] - Getter :
getNominalPower1() - Setter :
setNominalPower1(int)
Installation costs #1 (specificInstallationCosts1)
Specific installation costs for the complete photovoltaic system (modules + inverter + mounting), for nominal power #1.
Costs will be interpolated for nominal powers between 1 & 2.
- Type :
int -
Default :
1600 -
Unit :
[€/kWp] - Getter :
getSpecificInstallationCosts1() - Setter :
setSpecificInstallationCosts1(int)
Nominal Power #2 (nominalPower2)
Nominal power #2 for which specific installation costs are given.
- Type :
int -
Default :
100 -
Unit :
[kWp] - Getter :
getNominalPower2() - Setter :
setNominalPower2(int)
Installation costs #2 (specificInstallationCosts2)
Specific installation costs for the complete photovoltaic system (modules + inverter + mounting), for nominal power #2.
Costs will be interpolated for nominal powers between 1 & 2.
- Type :
int -
Default :
1400 -
Unit :
[€/kWp] - Getter :
getSpecificInstallationCosts2() - Setter :
setSpecificInstallationCosts2(int)
Self-consumption (selfConsumption)
Ratio describing how much of the produced PV electricity will be consumed directly on location, without being fed to the grid.
- Type :
int -
Default :
30 -
Unit :
[%] - Getter :
getSelfConsumption() - Setter :
setSelfConsumption(int)
Feed-in tariff (feedInTariff)
Payment made to households or businesses for the PV electricity they produce, and feed to the grid.
In most countries, it is lower than electricityCost, so produced PV electricity should preferably be used on location.
- Type :
double -
Default :
7.0 -
Unit :
[c€/kWh] - Getter :
getFeedInTariff() - Setter :
setFeedInTariff(double)
Electricity costs (electricityCost)
Cost (in c€/kWh) paid for electricity from the grid.
- Type :
double -
Default :
29.0 -
Unit :
[c€/kWh] - Getter :
getElectricityCost() - Setter :
setElectricityCost(double)
Operating costs (operatingCostsPercentagePerYear)
Operating costs per year needed in order to keep the photovoltaic system working (e.g. cleaning, insurance, new inverter after ~10 years, electricity for inverter, ...).
As a rough estimate, the operating costs can be assumed by between 1 to 1.5 percent of the acquisition cost of the solar panel system, annually.
- Type :
double -
Default :
1.0 -
Unit :
[%/a] - Getter :
getOperatingCostsPercentagePerYear() - Setter :
setOperatingCostsPercentagePerYear(double)
Cost of capital (costOfCapital)
Cost of capital. It is the minimum return that investors expect for providing capital.
The rate of return of a project should be higher than this value in order for it to be profitable.
- Type :
double -
Default :
2.0 -
Unit :
[%] - Getter :
getCostOfCapital() - Setter :
setCostOfCapital(double)
Used in
Photovoltaic Potential
Goal
- Calculates the technical potential for photovoltaics on buildings.
- Roofs and facades can be considered.
- A simple financial analysis is performed for each suitable surface.
- It returns:
- the potential nominal power in kWp
- the potential yield in MWh/a
- the number of suitable surfaces
- a CSV file with detailed information about every potential installation
- if desired, the total hourly output of those installations.
- The analysis should be done with LOD2 buildings.
- Takes geometry (orientation, area) and irradiance into account.
- Shadowing can be taken into account (see IrradianceProcessor). WARNING: This simulation is only a rough estimate. It might return correct orders of magnitude, provided the 3D-model, weather, irradiance and input parameters are correct.
Technical information
| Class | PhotovoltaicPotential |
| Superclass | WorkflowStepWithSimStadtGraphics |
| Author | |
| Maintainer | |
| Source location | simstadt/src/main/java/eu/simstadt/workflowsteps/PhotovoltaicPotential.java |
| Package | eu.simstadt.workflowsteps |
| Project | simstadt |
Dependencies
Parameters
LOD1? (includeLOD1)
Should LOD1 buildings be considered too?
Detailed roof geometry should be known for any meaningful photovoltaic potential analysis.
It is strongly recommended to only consider LOD2 buildings, so this option is disabled by default.
- Type :
boolean - Default :
false - Getter :
isIncludeLOD1() - Setter :
setIncludeLOD1(boolean)
Facades? (includeFacades)
Should facades be considered?
Shadowing calculations should have been activated in IrradianceProcessor (e.g. with SRA).
Given that no detailed information is known about the facade structure, results should only be used as very rough estimates.
- Type :
boolean - Default :
false - Getter :
isIncludeFacades() - Setter :
setIncludeFacades(boolean)
Tilted roofs? (includeTiltedRoofs)
Should tilted roofs be considered?
Photovoltaic modules are installed differently on tilted and flat roofs, it might make sense to analyze them separately.
- Type :
boolean - Default :
true - Getter :
isIncludeTiltedRoofs() - Setter :
setIncludeTiltedRoofs(boolean)
Flat roofs? (includeFlatRoofs)
Should LOD2 flat roofs be considered?
Photovoltaic modules are installed differently on flat and tilted roofs, it might make sense to analyze them separately.
Note that LOD1 roofs are considered separately, since they all look flat anyway.
- Type :
boolean - Default :
true - Getter :
isIncludeFlatRoofs() - Setter :
setIncludeFlatRoofs(boolean)
Minimum surface area (minimumSurfaceArea)
Required surface area, under which surfaces are not considered.
Set to 0 in order to consider every surface.
- Type :
int -
Default :
40 -
Unit :
[m²] - Getter :
getMinimumSurfaceArea() - Setter :
setMinimumSurfaceArea(int)
Minimum roof insolation (minimumRoofInsolation)
Required global insolation (in the plane of array), under which roof surfaces are not considered.
Set to 0 in order to consider every roof surface.
Shadows might be considered, depending on IrradianceProcessor.
- Type :
int -
Default :
1100 -
Unit :
[kWh/(m²·a)] - Getter :
getMinimumRoofInsolation() - Setter :
setMinimumRoofInsolation(int)
Minimum facade insolation (minimumFacadeInsolation)
Required global insolation (in the plane of array), under which facade surfaces are not considered.
Should probably be smaller than minimumRoofInsolation.
Set to 0 in order to consider every facade.
Shadows might be considered (and should), depending on IrradianceProcessor.
- Type :
int -
Default :
800 -
Unit :
[kWh/(m²·a)] - Getter :
getMinimumFacadeInsolation() - Setter :
setMinimumFacadeInsolation(int)
Module / flat roof area (moduleAreaToFlatRoofArea)
Ratio between installed module area and flat roof area.
By default, 30m² worth of modules will be installed on a 100m² flat roof.
It is smaller than the default for moduleAreaToTiltedRoofArea because spacing between rows is needed in order to avoid self-shading.
This parameter can be overwritten with a generic BoundarySurface attribute in CityGML file:
<gen:doubleAttribute name="moduleAreaToRoofArea"><gen:value>0.6789</gen:value></gen:doubleAttribute>
- Type :
int -
Default :
30 -
Unit :
[%] - Getter :
getModuleAreaToFlatRoofArea() - Setter :
setModuleAreaToFlatRoofArea(int)
Module / tilted roof area (moduleAreaToTiltedRoofArea)
Ratio between installed module area and tilted roof area.
By default, 40m² worth of modules will be installed on a 100m² tilted roof.
It is larger than the default for moduleAreaToFlatRoofArea because no spacing is required between modules.
This parameter can be overwritten with a generic BoundarySurface attribute in CityGML file:
<gen:doubleAttribute name="moduleAreaToRoofArea"><gen:value>0.6789</gen:value></gen:doubleAttribute>
- Type :
int -
Default :
40 -
Unit :
[%] - Getter :
getModuleAreaToTiltedRoofArea() - Setter :
setModuleAreaToTiltedRoofArea(int)
Module / LOD1 roof area (moduleAreaToLOD1RoofArea)
Ratio between installed module area and LOD1 roof area.
By default, 15m² worth of modules will be installed on a 100m² LOD1 roof.
It is half the default for moduleAreaToFlatRoofArea because the roof geometry is unknown, and half of the LOD1 might point to the wrong azimuth (e.g. north).
- Type :
int -
Default :
15 -
Unit :
[%] - Getter :
getModuleAreaToLOD1RoofArea() - Setter :
setModuleAreaToLOD1RoofArea(int)
Module / facade area (moduleAreaToFacadeArea)
Ratio between installed module area and facade area.
By default, 5m² worth of modules will be installed on a 100m² facade.
Window ratios are not known, so this ratio should be low and only considered as a very rough guess.
- Type :
int -
Default :
5 -
Unit :
[%] - Getter :
getModuleAreaToFacadeArea() - Setter :
setModuleAreaToFacadeArea(int)
Max flat roof elevation (maximumFlatRoofElevation)
Any roof surface at or below this elevation will be considered to be a flat roof, and the photovoltaic modules will be installed on a mounting rack, towards the south (assuming that the location is in the northern hemisphere) and at moduleTiltOnFlatRoof °.
Any roof surface over this elevation will be considered to be a tilted roof, and the photovoltaic modules will be installed parallel to the roof structure.
- Type :
int -
Default :
10 -
Unit :
[°] - Getter :
getMaximumFlatRoofElevation() - Setter :
setMaximumFlatRoofElevation(int)
Module efficiency (moduleEfficiency)
Module efficiency at STC (Standard Test Conditions. 1000W/m², T_module 25°C, Air-mass 1.5).
It should probably be between 10% and 22%.
- Type :
int -
Default :
15 -
Unit :
[%] - Getter :
getModuleEfficiency() - Setter :
setModuleEfficiency(int)
Module tilt on flat roof (moduleTiltOnFlatRoof)
Tilt at which modules will be installed on a flat roof. Modules will be installed towards the south.
The tilt depends on the latitude, and should probably be between 5° and 35°.
- Type :
int -
Default :
25 -
Unit :
[°] - Getter :
getModuleTiltOnFlatRoof() - Setter :
setModuleTiltOnFlatRoof(int)
Performance ratio (performanceRatio)
Performance ratio that the potential photovoltaic installation is supposed to achieve. It includes cable losses, MPP mismatch, modules mismatch, thermal losses, ...
This value should probably be between 75% and 95%.
- Type :
int -
Default :
85 -
Unit :
[%] - Getter :
getPerformanceRatio() - Setter :
setPerformanceRatio(int)
Calculate hourly values? (calculateHourlyValues)
Should a separate CSV file be written, containing the total AC Power from all potential photovoltaic systems?
- Type :
boolean - Default :
false - Getter :
isCalculateHourlyValues() - Setter :
setCalculateHourlyValues(boolean)
Used in
Physics Preprocessor
Goal
- Discards buildings for which year of construction is not defined
- Determines building type (e.g. single-family house, high tower, ...) depending on the chosen strategy (e.g. for German or NYC buildings)
- Loads either the default building physics library or a custom one, created with PhysicsLibraryEditor
- Assigns global properties (e.g. storey height, thermal bridge U-value, infiltration rate...) to each building depending on building type, year of construction and refurbishment variant (e.g. standard or EnEV2016).
- Assigns construction type, U-value and window ratio to every surface
- If desired, an outdated CityGML file can be statistically updated with an assessment scenario : e.g. 50% of single-family houses have been refurbished to EnEv2016 standard.
Technical information
| Class | PhysicsPreprocessor |
| Superclass | WorkflowStepAssessment |
| Author | |
| Maintainer | |
| Source location | simstadt/src/main/java/eu/simstadt/workflowsteps/PhysicsPreprocessor.java |
| Package | eu.simstadt.workflowsteps |
| Project | simstadt |
Dependencies
Parameters
Type assignment (buildingTypeStrategy)
Which strategy should be used in order to determine building type?
Currently available ones are for Germany (depending on building shape) and New-York City (depending on PLUTO attribute).
- Type :
BuildingTypeStrategy - Default :
GERMAN_BUILDING_TYPES_ASSIGNMENT - Possible values :
GERMAN_BUILDING_TYPES_ASSIGNMENT, NYC_BUILDING_TYPES_ASSIGNMENT - Getter :
getBuildingTypeStrategy() - Setter :
setBuildingTypeStrategy(BuildingTypeStrategy)
Use an assessment scenario? (useScenario)
Should an assessment scenario be used?
If the CityGML file is incomplete or out-dated, a custom scenario can be defined, for example in order to specify:
In PhysicsPreprocessor: which percentage of buildings have been refurbished, depending on their building types (30% of single-family houses before 1995 to KfW55).
In SystemsPreprocessor: which HVAC system (e.g. pellet boiler or air-source heat-pump) has been installed.
- Type :
boolean - Default :
false - Getter :
isUseScenario() - Setter :
setUseScenario(boolean)
Available libraries (libraries)
List of libraries which have been imported and are available.
Selection is done either via GUI or by setting selectedLibrary to the desired index.
- Type :
List - Default :
[German Building Typology Library IWU, NYC Building Physics Library, Dutch Building Physics Library according to TABULA] - Getter :
getLibraries() - Setter :
setLibraries(List)
Selected Library (selectedLibrary)
Index (between 0 and n-1) for the desired library out of the list of available ones (libraries).
- Type :
int - Default :
0 - Getter :
getSelectedLibrary() - Setter :
setSelectedLibrary(int)
Used in
- District Heating Network Analysis
- Environmental Analysis
- Environmental Analysis With Refurbishment Strategy
- Heat Demand Analysis
- Heat Demand Analysis With Energy ADEWriter
- Heat Demand Analysis With Refurbishment Strategy
- Hourly Heat Demand Analysis
- Hourly Heat Demand Analysis With Energy System
- Load Profile
- Water Food Demand Analysis
Primary Energy And Co2 Processor
Goal
Calculates primary energy and CO2 emissions for:
- Space heating
- Space cooling
- Domestic hot water
- Electrical appliances
Technical information
| Class | PrimaryEnergyAndCo2Processor |
| Superclass | WorkflowStepWithSimStadtGraphics |
| Author | |
| Maintainer | |
| Source location | simstadt/src/main/java/eu/simstadt/workflowsteps/PrimaryEnergyAndCo2Processor.java |
| Package | eu.simstadt.workflowsteps |
| Project | simstadt |
Dependencies
- Create SimStadt Model
- Geometric Preprocessor
- Import City Gml
- Irradiance Processor
- Monthly Energy Balance
- Physics Preprocessor
- Systems Preprocessor
- Usage Preprocessor
- Weather Processor
Parameters
Display space heating? (spaceHeatingDisplayed)
Should primary energy and CO2 emissions for space heating be displayed in maps and diagrams?
The corresponding values will be exported to the CSV file anyway.
- Type :
boolean - Default :
true - Getter :
isSpaceHeatingDisplayed() - Setter :
setSpaceHeatingDisplayed(boolean)
Display domestic hot water? (domesticHotWaterDisplayed)
Should primary energy and CO2 emissions for domestic hot water be displayed in maps and diagrams?
The corresponding values will be exported to the CSV file anyway.
- Type :
boolean - Default :
true - Getter :
isDomesticHotWaterDisplayed() - Setter :
setDomesticHotWaterDisplayed(boolean)
Display electrical appliances? (electricalAppliancesDisplayed)
Should primary energy and CO2 emissions for electrical appliances be displayed in maps and diagrams?
The corresponding values will be exported to the CSV file anyway.
- Type :
boolean - Default :
false - Getter :
isElectricalAppliancesDisplayed() - Setter :
setElectricalAppliancesDisplayed(boolean)
Used in
Refurbishment Scenario Maker
Goal
Lets the user define a refurbishment scenario :
- Should buildings be left as is? ("Status quo")
- How many buildings per year should be refurbished?
- To which standard? (e.g. EnEV2016)
- Depending on building usage? (e.g. residential)
- Depending on building typology? (e.g. multi-family house)
- Should they be picked randomly or should the oldest/less efficient be refurbished first?
The refurbishment will be applied before further processing (e.g. MonthlyEnergyBalance).
Technical information
| Class | RefurbishmentScenarioMaker |
| Superclass | WorkflowStepWithSimStadtGraphics |
| Author | |
| Maintainer | |
| Source location | simstadt/src/main/java/eu/simstadt/workflowsteps/RefurbishmentScenarioMaker.java |
| Package | eu.simstadt.workflowsteps |
| Project | simstadt |
Dependencies
- Create SimStadt Model
- Geometric Preprocessor
- Import City Gml
- Physics Preprocessor
- Usage Preprocessor
Parameters
Available strategies (strategies)
List of strategies which have been defined and are available
Selection is done either via GUI or by setting selectedLibrary to the desired index.
- Type :
List - Default :
[Status quo] - Getter :
getStrategies() - Setter :
setStrategies(List)
Selected Library (selectedStrategy)
Index (between 0 and n-1) for the desired strategy out of the list of available ones (strategies).
- Type :
int - Default :
0 - Getter :
getSelectedStrategy() - Setter :
setSelectedStrategy(int)
Used in
Systems Preprocessor
Goal
Lets the user specify the probability distribution of HVAC systems for the simulated buildings. For example: 40% air-source heat-pumps and 60% pellet boilers. This information is needed for environmental analysis, with primary energy and CO2 emissions.
Technical information
| Class | SystemsPreprocessor |
| Superclass | WorkflowStepAssessment |
| Author | |
| Maintainer | |
| Source location | simstadt/src/main/java/eu/simstadt/workflowsteps/SystemsPreprocessor.java |
| Package | eu.simstadt.workflowsteps |
| Project | simstadt |
Dependencies
- Create SimStadt Model
- Geometric Preprocessor
- Import City Gml
- Physics Preprocessor
- Usage Preprocessor
Parameters
Use an assessment scenario? (useScenario)
Should an assessment scenario be used?
If the CityGML file is incomplete or out-dated, a custom scenario can be defined, for example in order to specify:
In PhysicsPreprocessor: which percentage of buildings have been refurbished, depending on their building types (30% of single-family houses before 1995 to KfW55).
In SystemsPreprocessor: which HVAC system (e.g. pellet boiler or air-source heat-pump) has been installed.
- Type :
boolean - Default :
false - Getter :
isUseScenario() - Setter :
setUseScenario(boolean)
Available libraries (libraries)
List of libraries which have been imported and are available.
Selection is done either via GUI or by setting selectedLibrary to the desired index.
- Type :
List - Default :
[eu.simstadt.library.EnergySystemAndFuels] - Getter :
getLibraries() - Setter :
setLibraries(List)
Selected Library (selectedLibrary)
Index (between 0 and n-1) for the desired library out of the list of available ones (libraries).
- Type :
int - Default :
0 - Getter :
getSelectedLibrary() - Setter :
setSelectedLibrary(int)
Used in
Usage Preprocessor
Goal
- Defines usage zones (e.g. residential, office, ...) according to building function.
- Loads either the default building usage library or a custom one, created with UsageLibraryEditor
- Defines occupancy density, internal gains, set point temperatures, domestic hot water consumption and ventilation according to usage types.
- Custom building function codes can be defined in "AlkisCodes.xml".
- If building function is unknown, "residential" can be assumed.
- For German residential buildings, number of households and occupants are guesstimated.
- Buildings for which are building function is unknown are discarded.
Technical information
| Class | UsagePreprocessor |
| Superclass | WorkflowStepWithSimStadtGraphics |
| Author | |
| Maintainer | |
| Source location | simstadt/src/main/java/eu/simstadt/workflowsteps/UsagePreprocessor.java |
| Package | eu.simstadt.workflowsteps |
| Project | simstadt |
Dependencies
Parameters
Use 'AlkisCodes.xml'? (useAlkisCodesXml)
Custom building function codes can be used and specified in a 'AlkisCodes.xml' file, located in the same folder as the CityGML file.
The translated codes should be known by the building usage library.
Example:
<?xml version="1.0" encoding="ISO-8859-1"?>

<codes xmlns:buLib="http://www.simstadt.eu/BuildingUsageLibraries" xmlns="http://www.simstadt.eu/AlkisCodes">

<codesForBuildingUsageLibraryNamed>Germany_DIN18599</codesForBuildingUsageLibraryNamed>

  <code from="1113" to="3013"/> <!-- Post -->

  <code from="1134" to="3034"/> <!-- Museum -->

</codes>
- Type :
boolean - Default :
false - Getter :
isUseAlkisCodesXml() - Setter :
setUseAlkisCodesXml(boolean)
Assume residential if unknown? (assumeResidentialIfUnknown)
If a building does not have any "buildingFunction" attribute defined, should it be considered to be a residential building?
If this parameter is not selected, buildings without "buildingFunction" attribute will be discarded.
- Type :
boolean - Default :
false - Getter :
isAssumeResidentialIfUnknown() - Setter :
setAssumeResidentialIfUnknown(boolean)
Available libraries (libraries)
List of libraries which have been imported and are available.
Selection is done either via GUI or by setting selectedLibrary to the desired index.
- Type :
List - Default :
[Building Usage Library] - Getter :
getLibraries() - Setter :
setLibraries(List)
Selected Library (selectedLibrary)
Index (between 0 and n-1) for the desired library out of the list of available ones (libraries).
- Type :
int - Default :
0 - Getter :
getSelectedLibrary() - Setter :
setSelectedLibrary(int)
Used in
- District Heating Network Analysis
- Environmental Analysis
- Environmental Analysis With Refurbishment Strategy
- Heat Demand Analysis
- Heat Demand Analysis With Energy ADEWriter
- Heat Demand Analysis With Refurbishment Strategy
- Hourly Heat Demand Analysis
- Hourly Heat Demand Analysis With Energy System
- Load Profile
- Water Food Demand Analysis
Visualization
Goal
Renders the 3D model with yearly average of global irradiance on each surface.
Technical information
| Class | Visualization |
| Superclass | WorkflowStep |
| Author | |
| Maintainer | |
| Source location | simstadt/src/main/java/eu/simstadt/workflowsteps/Visualization.java |
| Package | eu.simstadt.workflowsteps |
| Project | simstadt |
Dependencies
Parameters
Image Height (imageHeight)
Height in pixels of the rendered image.
- Type :
int -
Default :
4000 -
Unit :
[px] - Getter :
getImageHeight() - Setter :
setImageHeight(int)
Image Width (imageWidth)
Width in pixels of the rendered image.
- Type :
int -
Default :
6000 -
Unit :
[px] - Getter :
getImageWidth() - Setter :
setImageWidth(int)
North Deviation (northDeviation)
Rotates the 3D model before rendering it. For cities with a regular grid which is not North-South aligned.
Positive for clockwise offset. As an example:
NYC : 29°, Barcelona : -45°
- Type :
int -
Default :
0 -
Unit :
[°] - Getter :
getNorthDeviation() - Setter :
setNorthDeviation(int)
Show Irradiance on LOD1? (showIrradianceOnLOD1)
Should irradiance be shown on LOD1 buildings?
Since the roof shape is not known for LOD1 buildings, rendering irradiance on the flat roof might might give a wrong impression.
LOD1 is not suited for detailed solar potential analysis.
- Type :
boolean - Default :
true - Getter :
isShowIrradianceOnLOD1() - Setter :
setShowIrradianceOnLOD1(boolean)
Point of view (view)
From which angle should the 3D model be rendered?
- Type :
View - Default :
Isometric_View - Possible values :
Isometric_View, Top_View, Front_View, Right_View - Getter :
getView() - Setter :
setView(View)
With irradiance graph? (withIrradianceGraph)
Renders an optional graph, representing the global insolation [kWh/(m².a)] depending on azimuth and tilt.
Can be used to validate weather data, e.g. if the correct time zone has been used for hourly values (the maximum insolation would not be centered on ~180° in this case).
- Type :
boolean - Default :
false - Getter :
isWithIrradianceGraph() - Setter :
setWithIrradianceGraph(boolean)
Used in
Water Food Demand Processor
Goal
Experimental workflowstep, designed to estimate the water and food demand of buildings
Technical information
| Class | WaterFoodDemandProcessor |
| Superclass | WorkflowStep |
| Author | |
| Maintainer | |
| Source location | simstadt-workflows-energy/src/main/java/de/hftstuttgart/simstadtworkflowsteps/biomass/WaterFoodDemandProcessor.java |
| Package | de.hftstuttgart.simstadtworkflowsteps.biomass |
| Project | simstadt-workflows-energy |
Dependencies
- Create SimStadt Model
- Geometric Preprocessor
- Import City Gml
- Physics Preprocessor
- Usage Preprocessor
Parameters
Federal State (federalState)
- Type :
FederalState - Default :
BADEN_WUERTTEMBERG - Possible values :
SCHLESWIG_HOLSTEIN, HAMBURG, NIEDERSACHSEN, NORDRHEIN_WESTFALEN, HESSEN, BADEN_WUERTTEMBERG, BAYERN, BRANDENBURG, MECKLENBURG_VORPOMMERN, SACHSEN_ANHALT, THUERINGEN, BERLIN, RHEINLAND_PFALZ, SACHSEN_ANHLAT, SAARLAND, SACHSEN, BREMEN - Getter :
getFederalState() - Setter :
setFederalState(FederalState)
Income per capita (income)
Average net income per capita. Used for residential water consumption
- Type :
int -
Default :
16500 -
Unit :
[€ / (person * year)] - Getter :
getIncome() - Setter :
setIncome(int)
Fresh water price (waterPrice)
€ / m³
- Type :
double - Default :
3.79 - Getter :
getWaterPrice() - Setter :
setWaterPrice(double)
Average age of population (age)
Average age of population
- Type :
double -
Default :
42.2 -
Unit :
[year] - Getter :
getAge() - Setter :
setAge(double)
GDP per capita (capitaGDP)
GDP per capita. Used for industry water consumption.
- Type :
int -
Default :
42000 -
Unit :
[€ / ( person * year)] - Getter :
getCapitaGDP() - Setter :
setCapitaGDP(int)
Used in
Weather Processor
Goal
- Retrieves weather data for the location of the model.
- Creates synthetic hourly values from monthly means.
Technical information
| Class | WeatherProcessor |
| Superclass | WorkflowStepWithSimStadtGraphics |
| Author | |
| Maintainer | |
| Source location | simstadt/src/main/java/eu/simstadt/workflowsteps/WeatherProcessor.java |
| Package | eu.simstadt.workflowsteps |
| Project | simstadt |
Dependencies
Parameters
Weather data source (weatherData)
Available weather data sources:
* Monthly global horizontal irradiance and ambient temperature from PVGIS online database (https://re.jrc.ec.europa.eu/pvg_tools/en/tools.html)

* Monthly global horizontal irradiance and ambient temperature from INSEL offline database

* Hourly global horizontal irradiance and ambient temperature from local TMY3 file

* Monthly global horizontal irradiance and ambient temperature from local TMY3 file
- Type :
WeatherDataSource - Default :
INSEL_Database - Possible values :
PVGIS_Database, INSEL_Database, TMY3_Hourly_File, TMY3_Monthly_File - Getter :
getWeatherData() - Setter :
setWeatherData(WeatherDataSource)
TMY3 filename (weatherFile)
Meteonorm TMY3 filename, with either hourly or monthly values.
The corresponding file should be present somewhere in :
* the repository folder

* the project folder

* or the workflowstep folder.
- Type :
String - Default :
Stuttgart-hour.tmy3 - Getter :
getWeatherFile() - Setter :
setWeatherFile(String)
Used in
- Biomass Analysis
- District Heating Network Analysis
- Environmental Analysis
- Environmental Analysis With Refurbishment Strategy
- Heat Demand Analysis
- Heat Demand Analysis With Energy ADEWriter
- Heat Demand Analysis With Refurbishment Strategy
- Hourly Heat Demand Analysis
- Hourly Heat Demand Analysis With Energy System
- Photovoltaic Potential Analysis
- Photovoltaic Potential Financial Analysis
- Solar Potential Analysis
- Water Food Demand Analysis
Ended: Workflowsteps
Simulation models ↵
Weather Data
Many workflows (e.g. Heat Demand Analysis & Photovoltaic Potential Analysis) require weather data for an accurate simulation.
Required data
The most basic information that is required for simulation are measured monthly values of:
Global Horizontal Irradiance (GHI)
Total irradiance from the sun on a horizontal surface on Earth.
Monthly average, in W/m².
Ambient temperature
Air temperature ~2m above the ground.
Monthly average, in °C.
Those monthly values can then be used to calculate other irradiances (e.g. DHI, DNI), if needed with a finer time step.
Sources
There are multiple sources for weather data in SimStadt. The source is usually described in the exported CSV files, e.g. from PhotovoltaicPotential or MonthlyEnergyBalance, since the weather data can obviously have a large impact on simulated results.
The currently available methods for data import in WeatherProcessor are:
INSEL
Monthly global horizontal irradiance and ambient temperature from INSEL offline database. Averages have been calculated from 20-year measurements (1970-1990), in 2000 ground-based weather stations around the world. This data import is the standard one in SimStadt, since it does not require an Internet connection. This dataset is getting old, though, and average temperatures are now approximately 1K higher than in this database.
PVGIS
Monthly global horizontal irradiance and ambient temperature from PVGIS online database. An Internet connection is required in order to use this data import. Downloads are saved in cache, so that the same data is not fetched every time a simulation is run. PVGIS data come from satellite-measurements, which have been calibrated and validated with ground-based weather stations (see PVGIS Data sources and calculation methods). Measurements are more recent than in the INSEL database. Europe data is available from SARAH3, with measurements between 2005 and 2023.
Current API version used in SimStadt is v5.3.
TMY3 format
- Hourly global horizontal irradiance and ambient temperature from local TMY3 file, which the user needs to provide manually.
- Monthly global horizontal irradiance and ambient temperature from local TMY3 file, which the user needs to provide manually.
Custom data
It's possible to use custom data by pasting them inside a TMY3 file.
Stuttgart-hour.tmy3 and Stuttgart-mon.tmy3 can be used as templates for hourly and monthly values.
Those files can be edited in LibreOffice Calc, by opening them as CSV, with comma as delimiter (do not use merge delimiters, it breaks the header!).
You can then edit:
- Location name (Cell B1)
- Latitude (E1)
- Longitude (F1)
- Elevation (G1)
- GHI, "Global Horizontal Irradiance", in column E
- DNI, "Direct Normal Irradiance", in column H
- DHI, "Diffuse Horizontal Irradiance", in column K
- Dry-bulb, "Dry-bulb ambient temperature", in column AF
Those values should be enough for every SimStadt simulation. The other columns can be left as-is or renamed NaN to indicate that they are not consistent anymore. They should not be deleted though, since that would change the column id of required data.
Optional data
- Sky temperature
- Global Irradiance in Plane of Array
- Precipitation
- Humidity
- Wind Speed
Algorithms
Hourly irradiance values
- Gordon, J. M., and T. Agami Reddy. "Time series analysis of hourly global horizontal solar radiation" Solar Energy 41.5 (1988): 423-429.
Auto-regressive model used to create synthetic hourly values from monthly values.
Used in INSEL
GENGTblock.
Diffuse horizontal irradiance
- Orgill, J. F., and K. G. T. Hollands. "Correlation equation for hourly diffuse radiation on a horizontal surface." Solar Energy 19.4 (1977): 357-359.
Model used to estimate Diffuse Horizontal Irradiance from Global Horizontal Irradiance.
Used in INSEL
G2GDHblock.
Sky temperature
- Swinbank, W. CQJR. "Long‐wave radiation from clear skies." Quarterly Journal of the Royal Meteorological Society 89.381 (1963): 339-348.
- Fuentes, Martin K. "A simplified thermal model for flat-plate photovoltaic arrays". No. SAND-85-0330. Sandia National Labs., Albuquerque, NM (USA), 1987
Sky Model
Liu & Jordan
Liu, Benjamin YH, and Richard C. Jordan. "The long-term average performance of flat-plate solar-energy collectors: with design data for the US, its outlying possessions and Canada." Solar energy 7, no. 2 (1963): 53-74.
Liu, Benjamin YH, and Richard C. Jordan. "The interrelationship and characteristic distribution of direct, diffuse and total solar radiation." Solar energy 4, no. 3 (1960): 1-19.
Hay
Hay, John E. "A revised method for determining the direct and diffuse components of the total short‐wave radiation." Atmosphere 14.4 (1976): 278-287.
Hay, John E., and Donald C. McKay. "Estimating solar irradiance on inclined surfaces: a review and assessment of methodologies." International Journal of Solar Energy 3.4-5 (1985): 203-240.
Perez
Perez, Richard, et al. "A new simplified version of the Perez diffuse irradiance model for tilted surfaces." Solar energy 39.3 (1987): 221-231.
Building Simulation
Monthly energy balance
Building simulation is done according to DIN V 18599, a German norm for monthly energy balance.
Hourly demand
Plausible hourly values can be synthesized from monthly values, with a modified version of VDI 4710, a German norm about degree days.
Simplified Radiosity Algorithm
Robinson, Darren, and Andrew Stone. "A simplified radiosity algorithm for general urban radiation exchange." Building services engineering research and technology 26.4 (2005): 271-284.
The radiant external environment may be described by two hemispheres, above and below the horizontal plane, which are discretized into a number of patches of known solid angle. Occlusions to these patches may be combined and represented as some patch fraction for which the radiant characteristics are defined by the dominant occlusion. By solving for radiant exchanges between each surface in a scene and its associated (un)occluded patches, we have a simplified radiosity algorithm (SRA). This paper describes the application of this SRA to solve for urban scale predictions of: (i) solar radiation; (ii) interior daylight; and (iii) longwave radiation. Comparisons of solar and daylight predictions with the ray-tracing program RADIANCE show that accurate results are achieved at a computational cost several orders of magnitude lower.
Practical application: This paper describes a new model for predicting external irradiance (shortwave and longwave) and internal illuminance in an accurate and very efficient way, in a single computational module. This module may be incorporated into existing software to improve the quality of predictions from single building thermal simulations as well as emerging software for urban scale predictions of integrated resource (energy, water, waste) flows, for which the model was developed.
Here is the installer for Windows : Simplified Radiosity Algorithm.
This algorithm has been developed for another project (CitySim), and can be used by SimStadt, e.g. in IrradianceProcessor when SRA_Perez is selected.
SRA too slow or unstable?
If too many buildings are considered by SRA, the calculation might become very slow or unstable. More than 500 buildings might be already too much for some systems.
One possibility is to split the CityGML model in smaller tiles, which can be done automatically by selecting SRA_Perez_with_tiling in IrradianceProcessor. The process has been detailed in "Setting intelligent city tiling strategies for urban shading simulations".
District Heating Layout
Algorithm
The algorithm used to generate a possible district heating layout is Prim's algorithm.
It tries to connect every single heated building to a powerplant (located at the center of mass of the 3D model), possibly along roads.
Data from OpenStreetMap
Source
Street layouts are obtained from OpenStreetMap and used by DistrictHeatingGenerator.
OSM Data
Data is downloaded as an OSM file and saved into cache, inside repository/.cache/open_street_maps folder.
As an example, here is the header of raw_region_N48_811__E9_166__N48_814__E9_169.osm:
<?xml version="1.0" encoding="UTF-8"?>
<osm version="0.6" generator="CGImap 0.8.2 (30016 thorn-03.openstreetmap.org)" copyright="OpenStreetMap and contributors" attribution="http://www.openstreetmap.org/copyright" license="http://opendatacommons.org/licenses/odbl/1-0/">
 <bounds minlat="48.8110000" minlon="9.1660000" maxlat="48.8140000" maxlon="9.1690000"/>
 <node id="26405955" visible="true" version="8" changeset="34832583" timestamp="2015-10-24T00:26:35Z" user="Jacob's-Staff" uid="2959582" lat="48.8139649" lon="9.1672583"/>
 <node id="26422421" visible="true" version="4" changeset="81742766" timestamp="2020-03-03T19:44:00Z" user="MrKrisKrisu" uid="1214889" lat="48.8133214" lon="9.1651029">
  <tag k="railway" v="signal"/>
  <tag k="railway:signal:direction" v="forward"/>
  <tag k="railway:signal:position" v="left"/>
  <tag k="railway:signal:speed_limit_distant" v="DE-BOStrab:g1a"/>
  <tag k="railway:signal:speed_limit_distant:form" v="sign"/>
  <tag k="railway:signal:speed_limit_distant:speed" v="40"/>
 </node>
 <node id="38443922" visible="true" version="5" changeset="81742766" timestamp="2020-03-03T19:44:00Z" user="MrKrisKrisu" uid="1214889" lat="48.8138607" lon="9.1664675">
  <tag k="barrier" v="entrance"/>
...
SimStadt streets.dat
SimStadt parses the OSM street layout data and converts it to a simpler format, with one row for each road segment.
For a road segment between Node 1 and Node 2, the corresponding row will contain those values:
- Node 1 ID
- Node 1 X
- Node 1 Y
- Node 1 Z
- Node 2 ID
- Node 2 X
- Node 2 Y
- Node 2 Z
- Road type
All the coordinates are in the local coordinate reference system, as specified in the CityGML file.
As an example, for streets_N48_811__E9_166__N48_814__E9_169_EPSG_31467.dat:
# Node1 ID; Node1 x; Node1 y; Node1 z; Node2 ID; Node2 x; Node2 y; Node2 z; Way type
267345320;3512276.1068151887;5408204.575150366;1.0;2283144497;3512278.9855862185;5408198.031363033;1.0;service
2283144497;3512278.9855862185;5408198.031363033;1.0;2448503417;3512280.8895549406;5408193.909753482;1.0;service
2448503417;3512280.8895549406;5408193.909753482;1.0;2448503416;3512283.811774525;5408187.655200804;1.0;service
2448503416;3512283.811774525;5408187.655200804;1.0;318480789;3512296.27922075;5408159.302508754;1.0;service
318480789;3512296.27922075;5408159.302508754;1.0;318480912;3512302.3916302137;5408145.203752755;1.0;service
...
This file is saved in cache, inside repository/.cache/open_street_maps folder, next to the corresponding OSM file.
The filename indicates that it holds information about streets in the bounding box between (48.811°N, 9.166°E) and (48.814°N, 9.169°E), in EPSG 31467 coordinate reference system.
Modify street layouts
It can happen that the street layout does not fit at all with the CityGML file, for example if the 3D model describes a future project while OpenStreetMap contains information about the current street layout. The pipes (in red on the diagram) will deviate completely from the buildings (in black):
Remove roads
In that case, it might be better to delete streets from the corresponding streets____.dat file, and leave only one row in the file, preferably close to the middle of the model:
Add new roads
It is also possible to define new roads in order to better match the building footprints.
Here is the content of the corresponding streets_N48_811__E9_166__N48_814__E9_169_EPSG_31467.dat file:
1;3512280;5408490;0.0;5;3512330;5408380;0.0;fake road for future project
5;3512330;5408380;0.0;2;3512370;5408270;0.0;fake road for future project
1;3512280;5408490;0.0;4;3512375;5408510;0.0;fake road for future project
4;3512375;5408510;0.0;6;3512420;5408410;0.0;fake road for future project
5;3512330;5408380;0.0;6;3512420;5408410;0.0;fake road for future project
2;3512370;5408270;0.0;3;3512480;5408310;0.0;fake road for future project
6;3512420;5408410;0.0;3;3512480;5408310;0.0;fake road for future project
This file has been written manually, but a script could be written in order to export larger layouts from CAD or GIS programs.
Here are all the defined roads (shown in green):
Here is the resulting district heating network, after having saved the streets file in cache and starting the simulation again:
Note that 7 new roads have been defined in the above file, but not all of them have been used for the district heating, since 4 of them were enough to connect every building.
Load Profile Generation
Köhler, Sally, Matthias Betz, and Ursula Eicker. "Stochastic Generation of Household Electricity Load Profiles in 15-minute Resolution on Building Level for Whole City Quarters." Energy Challenges for the Next Decade, 16th IAEE European Conference, August 25-28, 2019. International Association for Energy Economics, 2019.
This algorithm is used in LoadProfileGenerator.
Ended: Simulation models
Advanced topics ↵
User preferences
Regional settings
SimStadt will output the results files (e.g. CSV) according to the regional settings of your system.
- On a German computer, the decimal separator will be
,:DEBW_LOD2_2869;;48,87919;9,21519;3515855,64;5415777,78;LOD2;... - On an English computer, it will be
.:DEBW_LOD2_2869;;48.87919;9.21519;3515855.64;5415777.78;LOD2;...
This way, opening the CSV file in a spreadsheet (e.g. LibreOffice Calc) on the same computer should ensure that numbers get recognized correctly.
If you want to export the results to a different locale, you can modify the starting script (e.g. SimStadt.bat on Windows).
Here is the original script:
@ECHO OFF
cd /D "%~dp0"
set "maxRAM=2g"
set "startRAM=512m"

set "launch=java -d64 -classpath lib/*;workflows/* -Xms%startRAM% -Xmx%maxRAM% -Djava.util.logging.config.file=logging.properties"
REM Uncomment next line: Set to a specific language code (e.g. DE, FR or US) if you want CSV files to be written in the corresponding format.
REM set "launch=java -d64 -classpath lib/*;workflows/* -Xms%startRAM% -Xmx%maxRAM% -Djava.util.logging.config.file=logging.properties -Duser.language=en -Duser.country=US"
...
...
If your spreadsheet software is set to another regional setting, you can uncomment the line starting with REM set "launch=java by removing REM, and setting -Duser.language=en -Duser.country=US to the desired language.
@ECHO OFF
cd /D "%~dp0"
set "maxRAM=2g"
set "startRAM=512m"

set "launch=java -d64 -classpath lib/*;workflows/* -Xms%startRAM% -Xmx%maxRAM% -Djava.util.logging.config.file=logging.properties -Duser.language=en -Duser.country=US"
...
...
Toggle Maps and Diagrams
Diagrams and maps can be useful in order to understand simulations results. Preparing and displaying those graphics takes time and memory, though.
In order to launch simulation with large CityGML files, it might help to disable the graphics.
To do so, you can click on the settings (top-right of SimStadt window) and disable Show Maps & Graphics:
If you restart SimStadt or create a new Workflow, the GUI should be displayed without any map or diagram.
In order to display them again, click again on Show Maps & Graphics, and restart SimStadt.
Increase available memory
Simulations with large CityGML files can take a long time and require gigabytes of memory. By default, SimStadt will start with 512MB and increase to 2GB if needed.
If you want to increase the available space, you can specify maxRAM in the starting script (e.g. SimStadt.bat). For example:
@ECHO OFF
cd /D "%~dp0"
set "maxRAM=2g"
set "startRAM=512m"
...
...
with
@ECHO OFF
cd /D "%~dp0"
set "maxRAM=8g"
set "startRAM=1g"
in order to start with 1GB of RAM and increase to 8GB if needed.
Show "Add Step" button
It is possible to extend workflows by appending workflowsteps. Every workflowstep knows which workflowsteps are required as dependencies.
By enabling Show "Add Step" Button:
It becomes possible to add workflowsteps from the GUI:
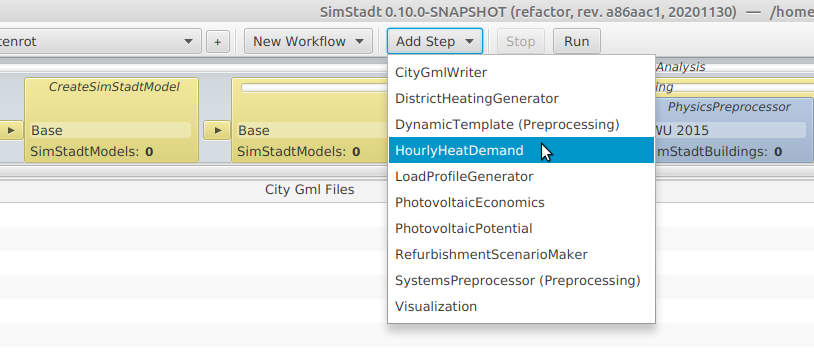
With this feature, multiple workflows can be combined, e.g. to calculate heat demand and photovoltaic potential with only one simulation.
Command line
It might be needed to launch SimStadt without GUI, e.g. on a headless server or to reduce memory consumption.
The corresponding class is called SimStadtCommandLineInterface.
Prerequisites
- Java 17 needs to be installed.
- INSEL probably needs to be installed.
- A repository. (e.g. TestRepositoryWithCache)
- At least one project needs to be inside the repository.
- At least one workflow needs to be inside the project:
- Either created with the GUI (define the parameters + Save button in the top-right corner)
- Or copied from another repository.
- Or created with a script, possibly from templates.
Syntax
SimStadt command line can be launched in the same way as SimStadt:
# On windows
java -d64 -classpath lib/*;workflows/* eu.simstadt.desktop.SimStadtCommandLineInterface [PATH_TO_FOLDER]
# On Linux
java -d64 -classpath lib/*:workflows/* eu.simstadt.desktop.SimStadtCommandLineInterface [PATH_TO_FOLDER]
In order to simplify the call, SimStadt.bat and SimStadt.sh scripts will launch SimStadtApp when called without argument and will launch SimStadtCommandLineInterface when called with at least one argument.
The argument should be an existing folder, containing either:
- a repository
- a project
- a workflow
Repository path as argument
When called with a repository path as argument, a list of available projects will be displayed.
./SimStadt.sh ../TestRepository
or
SimStadt.bat ..\TestRepositoryWithCache
outputs:
Launching: java -d64 -classpath lib/*:workflows/* -Xms512m -Xmx2g -Djava.util.logging.config.file=logging.properties eu.simstadt.desktop.SimStadtCommandLineInterface ../TestRepository
May 21, 2019 4:26:24 PM eu.simstadt.desktop.SimStadtCommandLineInterface main
INFO: Input could be a repository.
May 21, 2019 4:26:26 PM eu.simstadt.desktop.SimStadtCommandLineInterface getRepository
INFO: Found repository: /home/my_user/Desktop/TestRepository
May 21, 2019 4:26:26 PM eu.simstadt.desktop.SimStadtCommandLineInterface listProjects
INFO: Available projects for repository '/home/my_user/Desktop/TestRepository':
  Dirk                           : /home/my_user/Desktop/TestRepository/Dirk.proj
  Ensource                       : /home/my_user/Desktop/TestRepository/Ensource.proj
  Gruenbuehl                     : /home/my_user/Desktop/TestRepository/Gruenbuehl.proj
  Ludwigsburg                    : /home/my_user/Desktop/TestRepository/Ludwigsburg.proj
  Mainz                          : /home/my_user/Desktop/TestRepository/Mainz.proj
  Muenchen                       : /home/my_user/Desktop/TestRepository/Muenchen.proj
  NewYork                        : /home/my_user/Desktop/TestRepository/NewYork.proj
  Rotterdam                      : /home/my_user/Desktop/TestRepository/Rotterdam.proj
  ShadowExample                  : /home/my_user/Desktop/TestRepository/ShadowExample.proj
  SimpleBuilding                 : /home/my_user/Desktop/TestRepository/SimpleBuilding.proj
  SimpleBuildingWithEnergyADE    : /home/my_user/Desktop/TestRepository/SimpleBuildingWithEnergyADE.proj
  Singapore                      : /home/my_user/Desktop/TestRepository/Singapore.proj
  Stoeckach                      : /home/my_user/Desktop/TestRepository/Stoeckach.proj
  Stuttgart                      : /home/my_user/Desktop/TestRepository/Stuttgart.proj
  Test                           : /home/my_user/Desktop/TestRepository/Test.proj
  TestDIN18599                   : /home/my_user/Desktop/TestRepository/TestDIN18599.proj
  TestLandkreis                  : /home/my_user/Desktop/TestRepository/TestLandkreis.proj
  TwoSimpleBuildings             : /home/my_user/Desktop/TestRepository/TwoSimpleBuildings.proj
  Ulm_Wiblingen                  : /home/my_user/Desktop/TestRepository/Ulm_Wiblingen.proj
  Walheim                        : /home/my_user/Desktop/TestRepository/Walheim.proj
  WeBest                         : /home/my_user/Desktop/TestRepository/WeBest.proj
  Wuestenrot                     : /home/my_user/Desktop/TestRepository/Wuestenrot.proj
Project path as argument
When called with a project path as argument, a list of available workflows with be displayed.
./SimStadt.sh ../TestRepository/Gruenbuehl.proj
or
SimStadt.bat ..\TestRepositoryWithCache\NYC.proj
outputs:
Launching: java -d64 -classpath lib/*:workflows/* -Xms512m -Xmx2g -Djava.util.logging.config.file=logging.properties eu.simstadt.desktop.SimStadtCommandLineInterface ../TestRepository/Gruenbuehl.proj
May 21, 2019 4:29:08 PM eu.simstadt.desktop.SimStadtCommandLineInterface main
INFO: Input looks like a Project.
May 21, 2019 4:29:10 PM eu.simstadt.desktop.SimStadtCommandLineInterface getRepository
INFO: Found repository: /home/my_user/Desktop/TestRepository
May 21, 2019 4:29:10 PM eu.simstadt.desktop.SimStadtCommandLineInterface getProject
INFO: Found project: Gruenbuehl
May 21, 2019 4:29:10 PM eu.simstadt.desktop.SimStadtCommandLineInterface listWorkflows
INFO: Available workflows for project 'Gruenbuehl':
  /home/my_user/Desktop/TestRepository/Gruenbuehl.proj/a.step - Gruenbuehl_LOD2_ALKIS_1010_PhotovoltaicPotentialAnalysis (CityGmlWorkflow / PhotovoltaicPotentialAnalysis)
  /home/my_user/Desktop/TestRepository/Gruenbuehl.proj/b.step - Gruenbuehl_LOD2_ALKIS_1010_PhotovoltaicPotentialAnalysis (CityGmlWorkflow / PhotovoltaicPotentialAnalysis)
  /home/my_user/Desktop/TestRepository/Gruenbuehl.proj/c.step - Gruenbuehl_LOD2_ALKIS_1010_PhotovoltaicPotentialAnalysis (CityGmlWorkflow / PhotovoltaicPotentialAnalysis)
  /home/my_user/Desktop/TestRepository/Gruenbuehl.proj/d.step - Gruenbuehl_LOD2_ALKIS_1010_PhotovoltaicPotentialAnalysis (CityGmlWorkflow / PhotovoltaicPotentialAnalysis)
  /home/my_user/Desktop/TestRepository/Gruenbuehl.proj/e.step - Gruenbuehl_LOD2_ALKIS_1010_PhotovoltaicPotentialAnalysis (CityGmlWorkflow / PhotovoltaicPotentialAnalysis)
  /home/my_user/Desktop/TestRepository/Gruenbuehl.proj/f.step - Gruenbuehl_LOD2_ALKIS_1010_EnvironmentalAnalysis (CityGmlWorkflow / EnvironmentalAnalysis)
Workflow path as argument
When called with a workflow path as argument, the workflow will be launched and the result files will be listed.
./SimStadt.sh ../TestRepository/Gruenbuehl.proj/e.step
or
SimStadt.bat ..\TestRepositoryWithCache\NYC.proj\b.step
outputs:
Launching: java -d64 -classpath lib/*:workflows/* -Xms512m -Xmx2g -Djava.util.logging.config.file=logging.properties eu.simstadt.desktop.SimStadtCommandLineInterface ../TestRepository/Gruenbuehl.proj/e.step
May 21, 2019 4:35:41 PM eu.simstadt.desktop.SimStadtCommandLineInterface main
INFO: Input looks like a Workflow.
May 21, 2019 4:35:44 PM eu.simstadt.desktop.SimStadtCommandLineInterface getRepository
INFO: Found repository: /home/my_user/Desktop/TestRepository
May 21, 2019 4:35:44 PM eu.simstadt.desktop.SimStadtCommandLineInterface getProject
INFO: Found project: Gruenbuehl
May 21, 2019 4:35:44 PM eu.simstadt.desktop.SimStadtCommandLineInterface getWorkflow
INFO: Found workflow: CityGmlWorkflow [name=Gruenbuehl_LOD2_ALKIS_1010_PhotovoltaicPotentialAnalysis, pathToMe=e.step, selectedNext=Optional.empty, subWorkflowPath=a.step]
May 21, 2019 4:35:44 PM eu.simstadt.desktop.SimStadtCommandLineInterface launchWorkflow
INFO: Lauching: /home/my_user/Desktop/TestRepository/Gruenbuehl.proj/e.step - Gruenbuehl_LOD2_ALKIS_1010_PhotovoltaicPotentialAnalysis (CityGmlWorkflow / PhotovoltaicPotentialAnalysis)
May 21, 2019 4:35:51 PM de.hft.stuttgart.citydoctor.parsers.CityGMLParserImpl parse
INFO: Found CITY_MODEL version 2.0.0
May 21, 2019 4:35:51 PM de.hft.stuttgart.citydoctor.writer.CityDoctorModel loadWithEnergyADE
INFO: The city model contains 176 building features
May 21, 2019 4:35:54 PM eu.simstadt.datamodel.SimStadtModel <init>
INFO: Number of imported building units in model Gruenbuehl_LOD2_ALKIS_1010.gml: 0.
May 21, 2019 4:35:54 PM eu.simstadt.datamodel.SimStadtModel <init>
INFO: Number of imported building in model Gruenbuehl_LOD2_ALKIS_1010.gml: 176.
May 21, 2019 4:36:00 PM de.hftstuttgart.hierarchicworkflow.RepositoryNode isCacheUpToDate
INFO: Using available cache version (7) for /home/my_user/Desktop/TestRepository/.cache
May 21, 2019 4:36:00 PM eu.simstadt.weather.data.WeatherStation findNearest
INFO: Nearest weather station in INSELDB is 'Stuttgart / Germany' (12.4 km).
May 21, 2019 4:36:00 PM eu.simstadt.weather.processing.WeatherProcessing computeTsky
INFO: Tsky calculated with Swinbank Fuentes sky model
May 21, 2019 4:36:00 PM de.hftstuttgart.hierarchicworkflow.RepositoryNode isCacheUpToDate
INFO: Using available cache version (7) for /home/my_user/Desktop/TestRepository/.cache
May 21, 2019 4:36:00 PM eu.simstadt.irradiance.InselSkyModel isRadiationTableComplete
INFO: /home/my_user/Desktop/TestRepository/.cache/irradiances/tilted_irradiances_inseldb_Stuttgart_Hay__5_5.prn seems to be complete.
May 21, 2019 4:36:01 PM eu.simstadt.irradiance.InselSkyModel calculate
INFO: Azimuth Resolution = 5 / Tilt Resolution = 5 / Number of Orientation Categories = 1533 / Monthly Horizontal irradiances = [40, 70, 114, 168, 210, 227, 230, 186, 153, 95, 46, 32]
May 21, 2019 4:36:01 PM eu.simstadt.weather.processing.InselWeatherProcessing writeInselHourlyWeatherFile
INFO: Hourly weather file has been written to /tmp/hourly_gh_gdh_ta_inseldb_Stuttgart2683982879348766406.prn
May 21, 2019 4:36:01 PM eu.simstadt.simulation_plugins.insel.InselModelBuilder generateInselModel
INFO: INSEL model file /tmp/hourly_total_photovoltaic_production2205148307720236186.insel generated from sun.net.www.protocol.jar.JarURLConnection$JarURLInputStream@6c479748.
May 21, 2019 4:36:01 PM eu.simstadt.simulation_plugins.SimulationUtils lookForProgramInPath
INFO: insel has been found at : /usr/bin/insel
May 21, 2019 4:36:26 PM eu.simstadt.photovoltaic.HourlyPhotovoltaicProfileGenerator saveHourlyValuesAndCalculateTotal
INFO: Hourly PV Potential AC power written to /home/my_user/Desktop/TestRepository/Gruenbuehl.proj/e.step/a.step/a.step/a.step/a.step/a.step/a.step/Gruenbuehl_LOD2_ALKIS_1010_inseldb_Hay_pv_hourly_production.csv.
May 21, 2019 4:36:26 PM eu.simstadt.workflowsteps.PhotovoltaicPotential compareBothYields
INFO: Potential yield from yearly analysis : 897.9MWh/a. Hourly analysis : 888.9MWh/a. Difference : -1.0%
May 21, 2019 4:36:26 PM eu.simstadt.workflowsteps.PhotovoltaicPotential calculatePVPotentialAndExportResultsToCSV
INFO: PV Potential analysis result file written to /home/my_user/Desktop/TestRepository/Gruenbuehl.proj/e.step/a.step/a.step/a.step/a.step/a.step/a.step/Gruenbuehl_LOD2_ALKIS_1010_inseldb_Hay_pv_potential.csv.
May 21, 2019 4:36:26 PM de.hftstuttgart.hierarchicworkflow.TopLevelWorkflow initAndRun
INFO: Computation time was 0:00:42
May 21, 2019 4:36:26 PM eu.simstadt.desktop.SimStadtCommandLineInterface launchWorkflow
INFO: Finished: /home/my_user/Desktop/TestRepository/Gruenbuehl.proj/e.step - Gruenbuehl_LOD2_ALKIS_1010_PhotovoltaicPotentialAnalysis (CityGmlWorkflow / PhotovoltaicPotentialAnalysis)
May 21, 2019 4:36:26 PM eu.simstadt.desktop.SimStadtCommandLineInterface listFilesInSubfolders
INFO: These files have been written in '/home/my_user/Desktop/TestRepository/Gruenbuehl.proj/e.step':
  /home/my_user/Desktop/TestRepository/Gruenbuehl.proj/e.step/a.step/a.step/a.step/a.step/a.step/a.step/Gruenbuehl_LOD2_ALKIS_1010_inseldb_Hay_pv_hourly_production.csv
  /home/my_user/Desktop/TestRepository/Gruenbuehl.proj/e.step/a.step/a.step/a.step/a.step/a.step/a.step/Gruenbuehl_LOD2_ALKIS_1010_inseldb_Hay_pv_potential.csv
Data model
SimStadt v1
Here are the most often used classes and methods.
GUI Shortcuts
Keyboard shortcuts allow to work faster with the SimStadt GUI:
- Ctrl+N Creates a new workflow
- Ctrl+S Saves current workflow
- Ctrl+D Duplicates current workflow
- Ctrl+W Deletes current workflow
- Ctrl+W Runs current workflow
- Ctrl+P Shows available projects
- Ctrl+Z Stops current workflow, if running
- Ctrl+Tab Switches to next existing workflow
- Ctrl+Q Exits SimStadt
For macOs, please replace Ctrl with Cmd.
Add buildings to CityGML files
This tutorial shows how to create a simple solid building with SketchUp and export it to CityGML with the correct coordinates.
Note
This procedure also works with LoD2, with additional steps.
Setting up the SketchUp Template / Document
- Start SketchUp
- Go to File -> GeoLocation -> Add
- Select region as required and "grab" it.
Getting the coordinate origin for later georeferencing
- Find out the world coordinates of your SketchUp origin using GoogleMaps
- For this find the origin of your SketchUp coordinate system in GoogleMaps by comparing the images
- Place a marker at google maps (right click at desired location -> "what's here") which gives you the coordinates of this location in WGS84 Norting-Easting
- Copy and paste them in a text file for ease of use
- Go to: https://epsg.io/transform#s_srs=4326&t_srs=31467
- Convert your coordinates from WGS84 (Gmaps) to the desired one. Here we use "EPSG:31467 DHDN GK Zone3"
- Copy and paste the transformed coordinates in a text file for later use.
Modelling your buildings in SketchUp
- Save your current document, just in case we need to restart in the next step.
- Get the GEORES plugin and install it in SketchUp.
- Watch SketchUp tutorials on how to make simple buildings
- Once the buildings are made, select one at a time and click on the green house symbol from the GEORES Plugin Toolbar which says: "Erstelle ein neues Gebaeude"
- A pop-up appears, select "LoD1" or "LoD2" (depending on the roof shape) -> ok, a new pop-up appears, select "Solid" -> ok.
- Repeat this for all buildings.
- You can check that attributes of a building (e.g. gmlid) by going to the menu Tools -> GEORES citygml object dialog. Select an element and you can see the gmlid.
Exporting the SketchUp buildings to GML
- Go to menu Tools -> GEORES CityGML Export 2.0
- Fill in the values for Rechtswert, Hochwert with the ones we obtained before (in EPSG 31467)
- Fill in the height if you know it, else leave it empty. If you need this value depends on your application
- Select a path/file to store the GML.
- The other options don't seem to have an effect. Textures have not been tested.
- You must click on START now. If you close the dialog before clicking start it will not do anything!
- You will get a message that the file has been written successfully.
Repairing the exported GML
- There is a whitespace in one of the urls in the
- Open the XML file with a text editor and look for this:
<core:CityModel xmlns:xsi="http://www.w3.org/2001/XMLSchema-instance" xsi:schemaLocation="http://www.opengis.net/citygml/2.0 ./CityGML_2.0/CityGML.xsd" remove the whitespace here............................^ - Add the envelope behind the closing tag ">" of
<core:CityModel..... >and before<core:cityObjectMember>. For example:<gml:boundedBy> <gml:Envelope srsName="EPSG:31467" srsDimension="3"> <gml:lowerCorner>3513011.5993 5409874.8736 300</gml:lowerCorner> <gml:upperCorner>3513155.2613 5410004.6246 310.5</gml:upperCorner> </gml:Envelope> </gml:boundedBy> - To obtain the coordinates of the envelope either add and subtract as many meters as you need or follow the same procedure as you did to get the coordinates of the SketchUp origin.
- The plugin exports
.xmlfiles, but SimStadt expects CityGML files to have.gmlas extension. You can simply rename the extension fromfilename.xmltofilename.gml.
Adding new buildings to an existing CityGML model
Assuming that both CityGML files have the same coordinate reference system, it is possible to copy-paste buildings from one CityGML file to another.
To do so, open both CityGML files in a text editor with syntax highlighting (e.g. NotePad++), and copy the corresponding buildings, starting at <core:cityObjectMember> and ending at </core:cityObjectMember>.
- CityGML 1:
<?xml version="1.0" encoding="UTF-8" standalone="yes"?> <core:CityModel ...> <core:cityObjectMember> <bldg:Building gml:id="A"> ... ... ... </bldg:Building> </core:cityObjectMember> <core:cityObjectMember> <bldg:Building gml:id="B"> ... ... ... </bldg:Building> </core:cityObjectMember> </core:CityModel> - CityGML 2:
<?xml version="1.0" encoding="UTF-8" standalone="yes"?> <core:CityModel ...> <core:cityObjectMember> <bldg:Building gml:id="C"> ... ... ... </bldg:Building> </core:cityObjectMember> </core:CityModel> - CityGML 1 + 2:
<?xml version="1.0" encoding="UTF-8" standalone="yes"?>
<core:CityModel ...>
  <core:cityObjectMember>
    <bldg:Building gml:id="A">
        ...
        ...
        ...
    </bldg:Building>
  </core:cityObjectMember>
  <core:cityObjectMember>
    <bldg:Building gml:id="B">
        ...
        ...
        ...
    </bldg:Building>
  </core:cityObjectMember>
  <core:cityObjectMember>
    <bldg:Building gml:id="C">
        ...
        ...
        ...
    </bldg:Building>
  </core:cityObjectMember>
</core:CityModel>
cityObjectMember or Building?
In the video tutorial shown below, Buildings are copy-pasted around <bldg:Building>, which seems to work. It is advised to copy-paste <core:cityObjectMember>, though.
Python scripts
Here are some Python scripts which have been used for processing CityGML files, either independently from SimStadt or before launching SimStadt.
Make backups!
Feel free to use those scripts, but please be sure to have backups of your data before trying them.
Install Python
If Python is not installed yet on your computer, one easy (but heavyweight) way to install Python and many libraries is to install Anaconda. A more lightweight alternative is to install Miniconda, followed by required packages (pip install lxml pandas numpy).
Text editors and IDE
In order to edit and run Python code, you can use a text editor or an IDE. Some examples are:
Add attributes to CityGML buildings
Theory
A CityGML can have a correct geometry and be correctly georeferenced, but could still be missing information required for some workflows (e.g. Heat Demand Analysis).
CityGML files are plain text files, so they can be edited in a text editor (e.g. NotePad++).
<?xml version='1.0' encoding='UTF-8'?>
<CityModel xmlns:xal="urn:oasis...>
  <gml:boundedBy>
    <gml:Envelope srsName="EPSG:31467" srsDimension="3">
      <gml:lowerCorner>3515844.0567215136 5415761.814591559 0.0</gml:lowerCorner>
      <gml:upperCorner>3515946.174771333 5415791.804448826 0.0</gml:upperCorner>
    </gml:Envelope>
  </gml:boundedBy>
  <cityObjectMember>
    <bldg:Building gml:id="DEBW_LOD2_2960">
      <gml:boundedBy>
        <gml:Envelope srsName="urn:ogc:def:crs,crs:EPSG:6.12:31467,crs:EPSG:6.12:5783" srsDimension="3">
          <gml:lowerCorner>3515924.97 5415765.1 284.38</gml:lowerCorner>
          <gml:upperCorner>3515940.92 5415776.11 298.25</gml:upperCorner>
        </gml:Envelope>
      </gml:boundedBy>
      ...
It might not be very convenient to do so, though.
inject_citygml_attributes.py
In order to add missing attributes (e.g. yearOfConstruction or buildingFunction), inject_citygml_attributes.py can be used.
This script requires lxml, pandas and numpy.
usage: inject_citygml_attributes.py [-h] [input_folder] [output_folder]

Inject building attributes or generic attributes into CityGML files.
Each CityGML file inside input_folder should have a corresponding spreadsheet,
with the same filename as the CityGML but a different extension. (e.g. test.csv for test.gml).
If no spreadsheet is present, a CSV template will be automatically written, with the corresponding columns.
Supported formats : ['.xls', '.xlsx', '.ods', '.csv'].

positional arguments:
  input_folder   Input folder, containing CityGML files and their corresponding spreadsheets. (default: input)
  output_folder  Output folder, in which the modified CityGML will be written. (default: output)

optional arguments:
  -h, --help     show this help message and exit
- Download the script
- Create an
inputfolder - Move the CityGML (e.g.
test.gml) insideinputfolder - Run the script with
python inject_citygml_attributes.py -
It outputs:
INFO: # Parsing every gml file inside 'input' WARNING: No spreadsheet (.xls, .xlsx, .ods, .csv) has been found for input/test.gml WARNING: input/test.csv has been written as template. INFO: Finished all gml files in 0.00 s. -
test.csvhas been written insideinputfolder:BuildingID;yearOfConstruction;function;comment attribute_type;bldg;bldg;gen building123456789;1234;1010;Fake building DEBW_LOD2_2960 DEBW_LOD2_2869 -
You can modify it, e.g. either in a text editor or in LibreOffice Calc:
which looks like this in a spreadsheet editor:BuildingID;yearOfConstruction;function;comment attribute_type;bldg;bldg;gen DEBW_LOD2_2960;1978;1010;Some old residential building DEBW_LOD2_2869;2017;2020;Recent office building
| BuildingID | yearOfConstruction | function | comment |
|---|---|---|---|
| attribute_type | bldg | bldg | gen |
| DEBW_LOD2_2960 | 1978 | 1010 | Some old residential building |
| DEBW_LOD2_2869 | 2017 | 2020 | Recent office building |
-
You can add columns if desired. Building (
bldg) and generic (gen) attributes are supported. -
If you run the script again:
INFO: # Parsing every gml file inside 'input' INFO: ## Processing file input/test.gml... INFO: Processed 3 buildings. INFO: Finished writing output/test.gml. INFO: Finished all gml files in 0.02 s. -
A modified CityGML model has been written in
output:... </gml:boundedBy> <cityObjectMember> <bldg:Building gml:id="DEBW_LOD2_2960"> + <gen:stringAttribute name="comment"> + <gen:value>Some old residential building</gen:value> + </gen:stringAttribute> <gml:boundedBy> <gml:Envelope srsName="urn:ogc:def:crs,crs:EPSG:6.12:31467,crs:EPSG:6.12:5783" srsDimension="3"> <gml:lowerCorner>3515924.97 5415765.1 284.38</gml:lowerCorner> ... <energy:physicsProperties> <energy:yearOfRefurbishment/> </energy:physicsProperties> + <bldg:yearOfConstruction>1978</bldg:yearOfConstruction> + <bldg:function>1010</bldg:function> </bldg:Building> </cityObjectMember> <cityObjectMember> <bldg:Building gml:id="DEBW_LOD2_2869"> + <gen:stringAttribute name="comment"> + <gen:value>Recent office building</gen:value> + </gen:stringAttribute> <gml:boundedBy> <gml:Envelope srsName="urn:ogc:def:crs,crs:EPSG:6.12:31467,crs:EPSG:6.12:5783" srsDimension="3"> <gml:lowerCorner>3515848.53 5415767.63999609 284.8071</gml:lowerCorner> ... <energy:physicsProperties> <energy:yearOfRefurbishment/> </energy:physicsProperties> + <bldg:yearOfConstruction>2017</bldg:yearOfConstruction> + <bldg:function>2020</bldg:function> </bldg:Building> </cityObjectMember> </CityModel> -
This CityGML model now has enough data for Heat Demand Analysis!
other input & output folders
You can also specify the input and output folders:
python inject_citygml_attributes.py path/to/folder/with/citygmls some/output/folder
Give unique building IDs
After merging two CityGML files, some buildings might share the same ID.
citygml_give_unique_building_ids.py gives them unique IDs (e.g. Building A and Building A_2)
usage: citygml_give_unique_building_ids.py [-h]
                                           citygml_filename
                                           [citygml_filename ...]

Process CityGML files and give unique building IDs if needed.

positional arguments:
  citygml_filename

optional arguments:
  -h, --help        show this help message and exit
List Building IDs and Addresses
It might be useful to get a table of buildings IDs and addresses, directly from the CityGML file.
This script requires lxml.
list_building_ids_and_addresses.py
usage: list_building_ids_and_addresses.py [-h] [file_or_folder]

Parses a CityGML file, lists Building IDs and Addresses if available, and writes a CSV file along the CityGML.

positional arguments:
  file_or_folder  Path to citygml file, or path to folder containing multiple citygml files. Defaults to "input" folder.

optional arguments:
  -h, --help      show this help message and exit
python list_building_ids_and_addresses.py Gruenbuehl_LOD2_ALKIS_1010.gml
Extracting addresses from Gruenbuehl_LOD2_ALKIS_1010.gml...
  Gruenbuehl_LOD2_ALKIS_1010_addresses.csv has been written (with 176 addresses).
Here's a CSV example:
DEBW_51545799724;Deutschland,Ludwigsburg,123,Musterstraße
DEBW_51545797352;Deutschland,Ludwigsburg,234,Musterstraße
DEBW_51545798743;Deutschland,Ludwigsburg,456,Musterstraße
Other attributes
This script could be modified in order to output other attributes.
Run SimStadt workflows
It's possible to run SimStadt without graphical interface, directly from the command line.
run_simstadt_workflow.py can be used in order to automate the process further. Script will probably need to be tailored before it can run.
Get Open-Data CityGML
More and more countries and regions offer CityGML models as Open-Data. Here's an example in order to download LoD2 Geometry for Baden-Württemberg: get-bw-opendata.
New data model
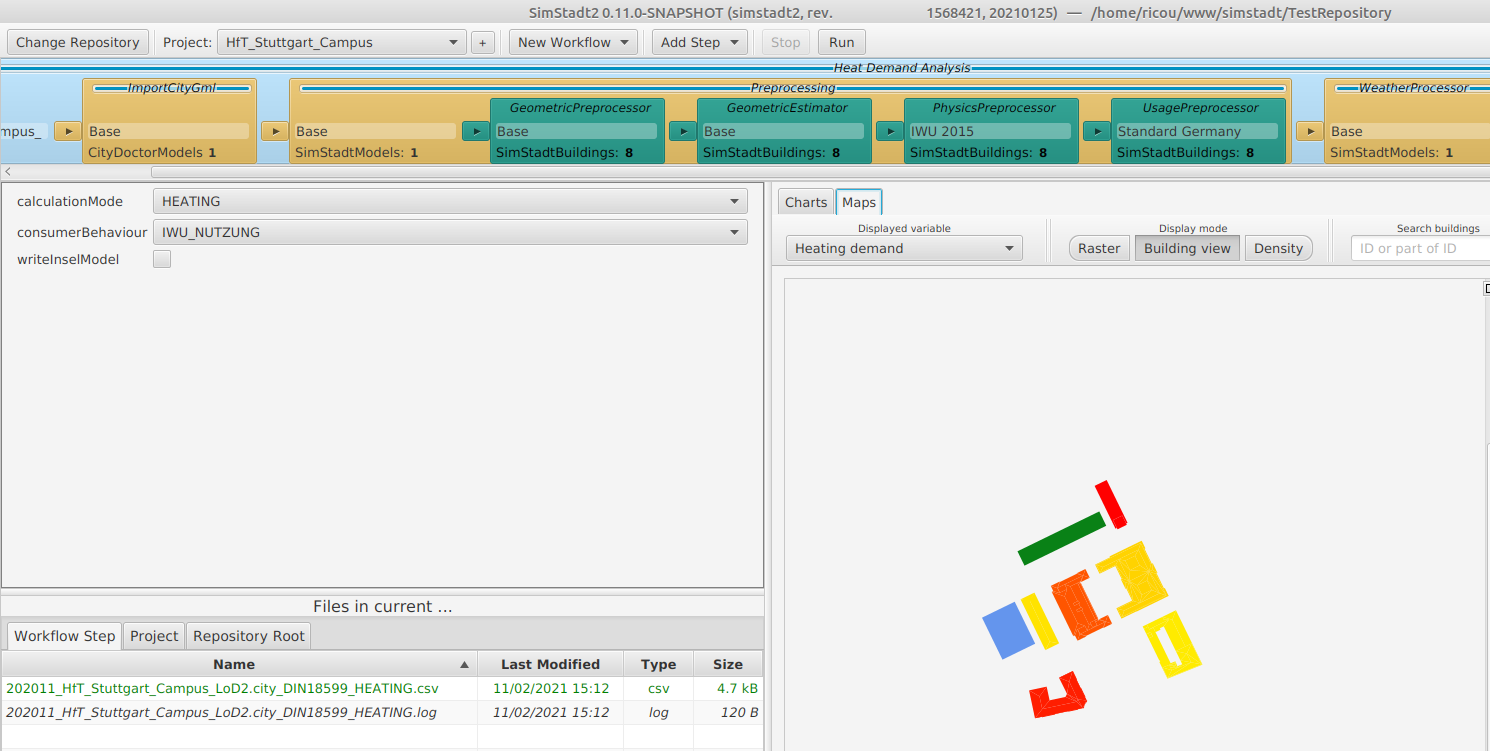
A new data model is actively in development. Goals were:
- to simplify the data model
- to define a functional part for each workflowstep in order:
- to increase modularity
- to allow workflows to be split on multiple servers
- define new workflows
This version is now the official one. The simulation results from the old version and the new one should be close to one another, but some variations are expected.
A release can be downloaded here.
Ended: Advanced topics
Developer how to ↵
Development process
Java JDK
The Java Development Kit (JDK) is a software development environment used for developing Java applications and applets. It includes the Java Runtime Environment (JRE), an interpreter/loader (java), a compiler (javac), an archiver (jar), a documentation generator (javadoc) and other tools needed in Java development.
The Java Development Kit (JDK) is required in order to compile SimStadt or a new SimStadt workflow. The current SimStadt version requires Java 17, and will not compile with older versions.
You can download a full JDK 17 from Liberica.
Eclipse
Most of SimStadt has been developed and tested with Eclipse, an open source integrated development environment (IDE).
Tools for developers working with Java and Web applications, including a Java IDE, tools for Web Services, Maven and Gradle, Git, and more.
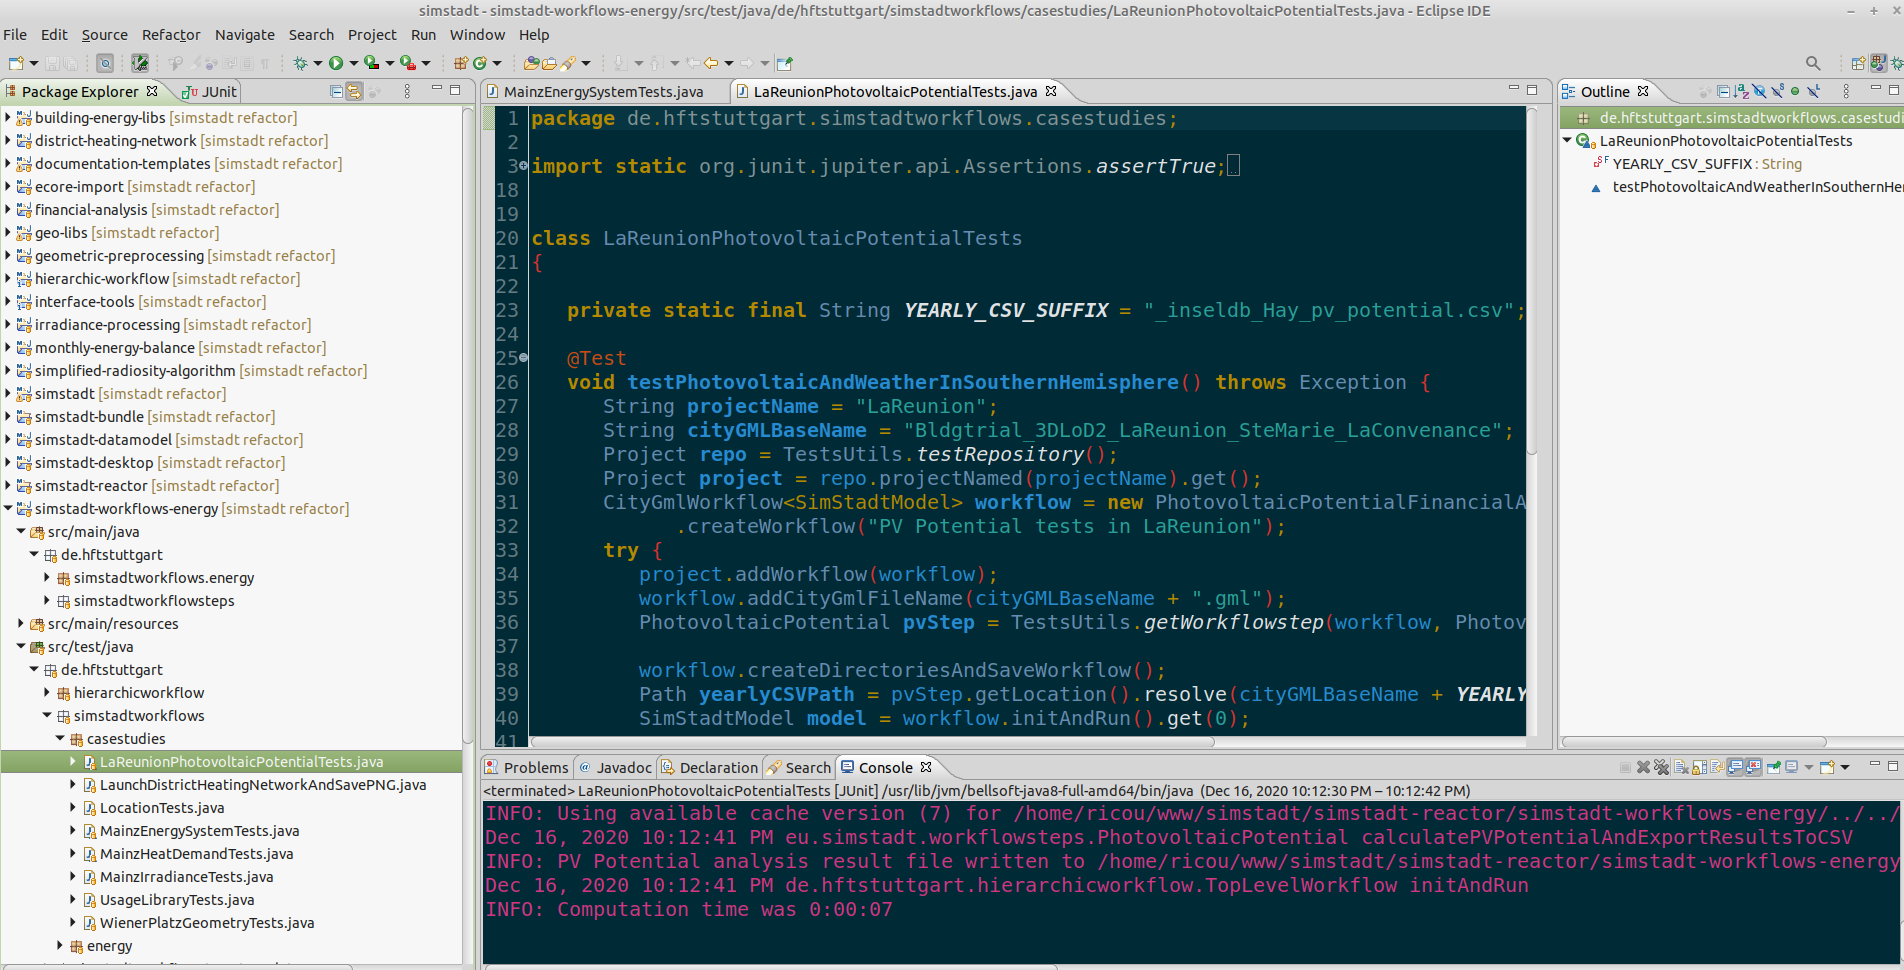
Download link : Eclipse IDE for Enterprise Java Developers.
Run SimStadt GUI from Eclipse
In order to run SimStadt GUI from Eclipse, the file
simstadt-desktop/src/main/java/eu/simstadt/desktop/SimStadtApp.java
needs to be run as "Java Application".
Add Workflows
In order to make sure that SimStadt GUI finds the defined workflows, the corresponding projects can be added to the Build Path in simstadt-desktop > Properties.
simstadt-workflows-energysimstadt-workflows-loadprofile

Note
Another possibility is to add the corresponding projects to the Classpath in "Run Configurations", but this method sometimes fails for some workflows (e.g. DistrictHeatingNetwork).
Git
Git is a distributed version-control system for tracking changes in any set of files, originally designed for coordinating work among programmers cooperating on source code during software development.
Software needed
- git client
- SSH client
- ssh-agent allows user to only type passphrase once per session.
- TortoiseGit can be very useful for browsing the repository.
- IDE integration:
- VSCode or VSCodium, with Git plugin
- or Eclipse with EGit
SimStadt repository
The SimStadt repository is at :
ssh://git@simstadt.hft-stuttgart.de/simstadt
Private repository
Please note that only HfT colleagues and project partners have access to the source-code. SimStadt might be open-sourced in the future.
- Server : simstadt.hft-stuttgart.de
- Port : 22
- User : git
- Repository : simstadt
The user is called git for everyone. The user management is done via the public key. For example:
ssh-rsa AAAAB3NzaC1yc2EAAAADAQABAAABAQCzaFc2VFhnp3wHQ6IisQnfdCZynamrL6QKr8K8esLSl/WJbgNdmS1eU79disAhcqgXP9Z3ISlHOn3CHfgOKlfk+29FoDgTis5YjjeUklI1+HTw19XcwrQlWyVABWWgyD4QAvTF0x9XEVqzpGanSbRC/S6smx2xHHQ2JTuBKRw6D/UYG5ZdXL27A5ZW31h8Q8iBTKhIShNm8fajiBM0eYIuOuh1M+tM7vlfMxbe7xJsgkX1fO9I1kUtQ13mIPm/i0biS4fkIx568T5tHc26oZYOwZLSIOUz4mHSAdPU4a9tQnsvL9BGOUqhKxO7DKtOx5Y4/Y5IQ6hYayZJqd1ng5gf vorname.nachname@hft-stuttgart.de
SimStadt documentation repository
The SimStadt Documentation repository is at :
ssh://git@simstadt.hft-stuttgart.de/simstadt_doc
Steps
- Create a SSH key pair with puttygen
- Send the public key to Eric
- Clone the repository at
ssh://git@simstadt.hft-stuttgart.de/simstadt
Maven
Apache Maven is a build automation tool used primarily for Java projects.
It is used for the SimStadt project in order to:
- manage dependencies
- compile
- run tests
- create a package containing executables, libraries and workflows.
Run Maven from terminal
mvn clean package can be run in any folder containing a pom.xml file.
In order to compile every package, mvn clean package should be run inside simstadt/simstadt-reactor
[INFO] Building zip: simstadt/simstadt-reactor/simstadt-bundle/target/SimStadt_0.10.0-SNAPSHOT_refactor_20210210_8cdc823.zip
[INFO] ------------------------------------------------------------------------
[INFO] Reactor Summary for SimStadt Reactor 0.10.0-SNAPSHOT:
[INFO]
[INFO] SimStadt Reactor ................................... SUCCESS [  2.178 s]
[INFO] Interface Tools .................................... SUCCESS [  3.692 s]
[INFO] Building Data Libraries ............................ SUCCESS [  4.811 s]
[INFO] Geo Libs ........................................... SUCCESS [  1.730 s]
[INFO] template-processing ................................ SUCCESS [  0.242 s]
[INFO] Simulation Plugins ................................. SUCCESS [  0.378 s]
[INFO] District Heating Network ........................... SUCCESS [  0.364 s]
[INFO] Hierarchic Workflows ............................... SUCCESS [  0.665 s]
[INFO] Ecore Import ....................................... SUCCESS [  0.468 s]
[INFO] Geometric Preprocessing ............................ SUCCESS [  0.372 s]
[INFO] Financial Analysis ................................. SUCCESS [  0.266 s]
[INFO] Weather Processing ................................. SUCCESS [  0.364 s]
[INFO] Irradiance Processing .............................. SUCCESS [  0.166 s]
[INFO] SimStadt Data Model ................................ SUCCESS [  0.373 s]
[INFO] Monthly Energy Balance ............................. SUCCESS [  0.615 s]
[INFO] Simplified Radiosity Algorithm ..................... SUCCESS [  0.377 s]
[INFO] SimStadt ........................................... SUCCESS [  1.880 s]
[INFO] SimStadt Workflows Energy .......................... SUCCESS [  1.399 s]
[INFO] SimStadt Workflows Load-Profile .................... SUCCESS [  0.652 s]
[INFO] Documentation Templates ............................ SUCCESS [  0.260 s]
[INFO] SimStadt Desktop ................................... SUCCESS [  0.409 s]
[INFO] SimStadt Bundle .................................... SUCCESS [ 12.506 s]
[INFO] ------------------------------------------------------------------------
[INFO] BUILD SUCCESS
[INFO] ------------------------------------------------------------------------
[INFO] Total time:  34.544 s
[INFO] Finished at: 2021-02-10T11:23:02+01:00
[INFO] ------------------------------------------------------------------------
mvn clean package 80,79s user 2,62s system 227% cpu 36,615 total
Tests might run for a very long time. A flag can be used in order to skip them : mvn clean package -DskipTests=true
The resulting zip package will be saved inside simstadt/simstadt-reactor/simstadt-bundle/target/.
Run Maven Eclipse
Maven can also be run from Eclipse.
clean package can be used as Maven Goals, and Skip Tests can be checked if desired.
Missing dependencies
If mvn clean package fails with:
[INFO] SimStadt Bundle .................................... FAILURE [  0.081 s]
[INFO] ------------------------------------------------------------------------
[INFO] BUILD FAILURE
[INFO] ------------------------------------------------------------------------
[INFO] Total time:  27.231 s
[INFO] Finished at: 2021-02-10T11:39:37+01:00
[INFO] ------------------------------------------------------------------------
[ERROR] Failed to execute goal on project simstadt-bundle: Could not resolve dependencies for project eu.simstadt:simstadt-bundle:pom:0.10.0-SNAPSHOT: Could not find artifact eu.simstadt:region-chooser:jar:0.2.2-SNAPSHOT in non-maven-libs (file://simstadt/simstadt-reactor/simstadt-bundle//../non-maven-libs) -> [Help 1]
It means that RegionChooser should be downloaded, compiled and installed first. See RegionChooser#install.
Hierarchical Workflow
SimStadt simulations are executed via Workflows.
Workflow

A workflow is a sequence of workflowsteps. For example:
- Read a CityGML file
- Create a SimStadtModel
- Preprocessing
- Get weather information for the location
- Calculate irradiance on every surface
- Check if roof surfaces are suitable for photovoltaic.
This workflow needs a CityGML filename as an input, and outputs a CSV file with the suitable roofs. The output of each workflowstep needs to match the input of the following workflowstep.
This process will also work with a stream of CityGML filenames as input. In this case, the whole sequence will be run for every filename, and multiple CSV files will be written.
Sub-workflow
A complete workflow can be used as a workflowstep, inside a larger workflow.
For example, a Preprocessing sub-workflow can be defined as:
- Check geometry
- Look for roof, wall and ground surfaces
- Calculate volume
Top-level workflow
Since Preprocessing receives a SimStadtModel, it iterates over every SimStadtBuilding inside the SimStadtModel, before calling the inner workflowsteps. Once every step has been called for every building, Preprocessing returns a SimStadtModel so that the outer workflow can continue.
The complete workflow becomes:
Workflow builder
Workflows can be defined with a WorkflowBuilder. For example, in PhotovoltaicPotentialAnalysisWorkflowProvider:
    @Override
    public CityGmlWorkflow<SimStadtModel> buildWorkflow() {
        return new CityGmlWorkflow<>(WorkflowBuilder
                .start(new ImportCityGml())
                .next(new CreateSimStadtModel())
                .next(new Preprocessing(WorkflowBuilder
                        .start(new GeometricPreprocessor())))
                .next(new WeatherProcessor())
                .next(new IrradianceProcessor())
                .next(new PhotovoltaicPotential()));
    }
Implement a new workflow
It is possible to define a new SimStadt workflow without having access to the complete SimStadt source code.
You will need Java 17 JDK, SimStadt jars and an IDE (e.g. Eclipse or Netbeans).
Screencast
Integration with other software
SimStadt mostly works with plain text files (CSV, CityGML, XML, ), which means it should be easy to import those files from other programs or export them to the desired format.
CSV
CSV files can be parsed by many programs, including:
CSV files are exported by many workflows (Heat Demand Analysis, Photovoltaic Potential Analysis, ...) and many tables are written in cache as CSV.
CityGML
CityGML can be exported/modified in:
XML
XML files are used by building physics library and building usage library, among others. They can be edited in NotePad++ and viewed in a browser.
INSEL models
INSEL models are already used by SimStadt, in the background.
They are plain text files, and can be written dynamically by SimStadt with DynamicTemplate. Here's an example:
% Calculates a*b
s 1 MUL  3.1 2.1
s 2 CONST
p 2
    {{a}}
s 3 CONST
p 3
    {{b}}
s 4 SCREEN  1.1
p 4
    '*'
Eclipse Projects
SimStadt v1
SimStadt is composed of many Maven projects, which are imported into separate Eclipse projects. Here is a dependency graph:
Write tests
Tests should be written for every workflow/workflowstep, as well as every important class. They are written in Java, with JUnit 5.
In order to create a new test, the easiest way is to right click on the class to be tested, in Eclipse, and choose New > JUnit Test Case.
Basic example
- The first step is to write just enough code so that the tests compile:
package eu.simstadt.workflows; import static org.junit.jupiter.api.Assertions.*; import org.junit.jupiter.api.Test; class VeryBasicTests { @Test void testStringConcatenation() { assertEquals("ab", f("a", "b"), "f should concatenate strings."); } private String f(String a, String b) { return null; } } - Tests can be run with
Run As > JUnit Test. The tests should fail. This step is really important, because otherwise, it's all too easy to write tests which don't test anything:org.opentest4j.AssertionFailedError: f should concatenate strings. ==> expected: <ab> but was: <null> at org.junit.jupiter.api.AssertionUtils.fail(AssertionUtils.java:55) at org.junit.jupiter.api.AssertionUtils.failNotEqual(AssertionUtils.java:62) at org.junit.jupiter.api.AssertEquals.assertEquals(AssertEquals.java:182) at org.junit.jupiter.api.Assertions.assertEquals(Assertions.java:1135) at eu.simstadt.workflows.VeryBasicTests.testStringConcatenation(VeryBasicTests.java:10) ...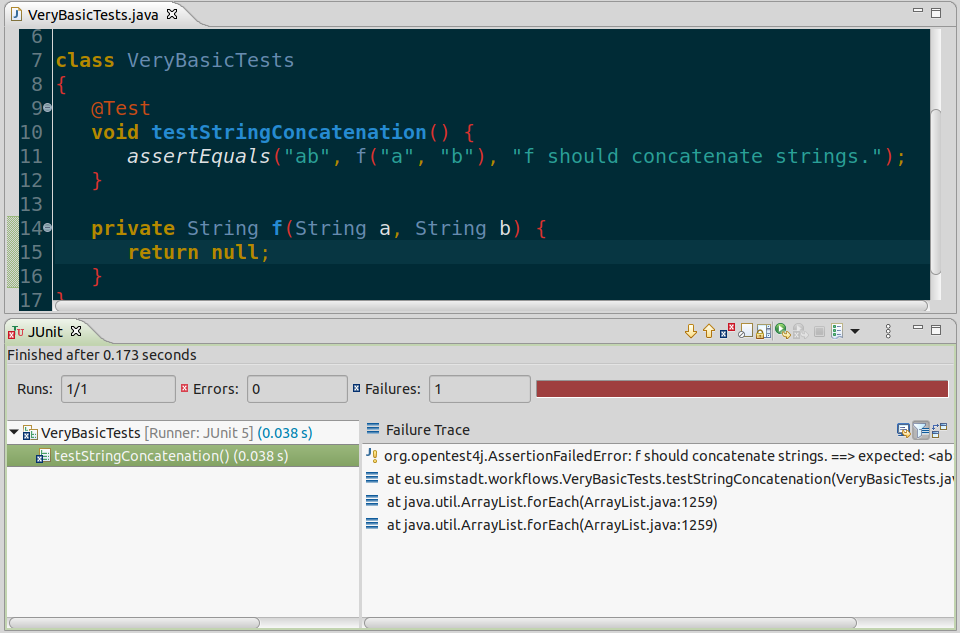
- Without touching the testing methods, the tested code should be modified until the tests pass:
    private String f(String a, String b) {
-       return null;
+       return a + b;
    }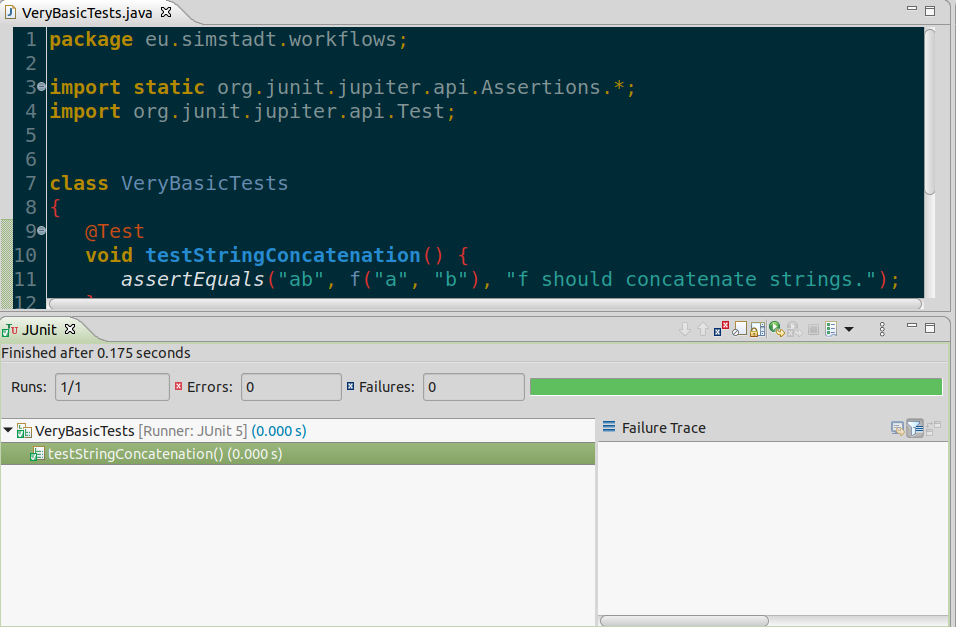
- The tests should be run every time the corresponding code is modified. Continuous integration software, such as Jenkins, can help.
Complete example
Here is a complete example for a photovoltaic analysis in La Réunion.
It creates a workflow, runs it and checks if the results (temperature, irradiance, orientation on flat roof) are plausible for a location in the Southern Hemisphere.
package de.hftstuttgart.simstadtworkflows.casestudies;

import static org.junit.jupiter.api.Assertions.assertTrue;
import java.nio.file.Path;
import org.junit.jupiter.api.Test;
import de.hftstuttgart.hierarchicworkflow.Project;
import de.hftstuttgart.hierarchicworkflow.WorkflowUtils;
import de.hftstuttgart.simstadtworkflows.energy.PhotovoltaicPotentialAnalysisWorkflowProvider;
import eu.simstadt.datamodel.SimStadtModel;
import eu.simstadt.irradiance.IrradianceTable;
import eu.simstadt.utils.TestsUtils;
import eu.simstadt.utils.UTF8WithBOM;
import eu.simstadt.weather.data.WeatherDataSet;
import eu.simstadt.workflows.CityGmlWorkflow;
import eu.simstadt.workflowsteps.IrradianceProcessor;
import eu.simstadt.workflowsteps.PhotovoltaicPotential;
import eu.simstadt.workflowsteps.WeatherProcessor;


class LaReunionPhotovoltaicPotentialTests
{
    @Test
    void testPhotovoltaicAndWeatherInSouthernHemisphere() throws Exception {
        String cityGMLBaseName = "Bldgtrial_3DLoD2_LaReunion_SteMarie_LaConvenance";
        Project repo = TestsUtils.testRepository();
        Project project = repo.projectNamed("LaReunion").get();
        CityGmlWorkflow<SimStadtModel> workflow = new PhotovoltaicPotentialAnalysisWorkflowProvider()
                .createWorkflow("PV Potential tests in LaReunion");
        try {
            project.addWorkflow(workflow);
            workflow.addCityGmlFileName(cityGMLBaseName + ".gml");
            PhotovoltaicPotential pvStep = TestsUtils.getWorkflowstep(workflow,
                    PhotovoltaicPotential.class);

            workflow.createDirectoriesAndSaveWorkflow();
            Path yearlyCSVPath = pvStep.getLocation().resolve(cityGMLBaseName +
                    "_inseldb_Hay_pv_potential.csv");
            SimStadtModel model = workflow.initAndRun().get(0);

            WeatherDataSet weather = model.getAttribute(WeatherProcessor.WEATHER_DATA_SET);
            double[] monthlyTemperatures = weather.getAmbientTemperature().getMonthlyAverages();
            double[] monthlyIrradiances = weather.getGlobalHorizontalIrradiance().getMonthlyAverages();
            IrradianceTable irradianceTable = model.getAttribute(IrradianceProcessor.IRRADIANCE_TABLE);

            assertTrue(
                    irradianceTable.getAverageIrradiance(0, 30) >
                    irradianceTable.getAverageIrradiance(180, 30) * 1.20,
                    "Modules to the North should get much more irradiance than to the South");

            assertTrue(monthlyIrradiances[0] > monthlyIrradiances[5] * 1.20,
                    "January should be summer");
            assertTrue(monthlyTemperatures[0] > monthlyTemperatures[5] + 5,
                    "January should be summer");

            String yearlyCSVContent = UTF8WithBOM.read(yearlyCSVPath);
            assertTrue(yearlyCSVContent.contains("Module azimuth on flat roof;0;°"),
                    "Modules should be oriented towards the north, in the southern hemisphere.");
        } finally {
            WorkflowUtils.deleteDirectory(workflow.getLocation());
        }
    }
}
Run Multiple Tests
Most important classes
SimStadtApp
eu.simstadt.desktop.SimStadtApp is the class which defines the SimStadt GUI.
package eu.simstadt.desktop;
public class SimStadtApp extends WorkflowApplication{
...
Run it as Java from Eclipse to start the GUI.
SimStadtCommandLineInterface
SimStadtCommandLineInterface is the class which can run workflows from the command line.
package eu.simstadt.desktop;

/*
 * Utility class to launch a SimStadt Workflow without GUI.
 * Repository, Projects and Workflows must already be present (either written by another script or created and saved by SimStadt-Desktop).
 */
public class SimStadtCommandLineInterface{
...
SimStadtModel
SimStadtModel is a CityGML file which has been parsed and converted to SimStadt data model.
package eu.simstadt.datamodel;

public class SimStadtModel{
...
SimStadtBuilding
SimStadtBuilding is a CityGML building which has been parsed and converted to SimStadt data model.
package eu.simstadt.datamodel;

public class SimStadtBuilding{
...
CityGmlWorkflow
CityGmlWorkflow is a top level workflow, which can be used in order to build a new Workflow. Output is generic (but will most often be SimStadtModel), input is a stream of CityGml files.
package eu.simstadt.workflows;

/**
 * Special top level workflow for processing CityGml files with the given output type (e.g. SimStadtModel)
 *
 * @param <Y>
 */
public class CityGmlWorkflow<Y> extends TopLevelWorkflow<File, Y>{
...
For example, in PhotovoltaicPotentialAnalysisWorkflowProvider:
    @Override
    public CityGmlWorkflow<SimStadtModel> buildWorkflow() {
        return new CityGmlWorkflow<>(WorkflowBuilder
                .start(new ImportCityGml())
                .next(new CreateSimStadtModel())
                .next(new Preprocessing(WorkflowBuilder
                        .start(new GeometricPreprocessor())))
                .next(new WeatherProcessor())
                .next(new IrradianceProcessor())
                .next(new PhotovoltaicPotential()));
    }
SceneBuilder
Scene Builder is a visual, drag'n'drop, layout tool for designing JavaFX application user interfaces.
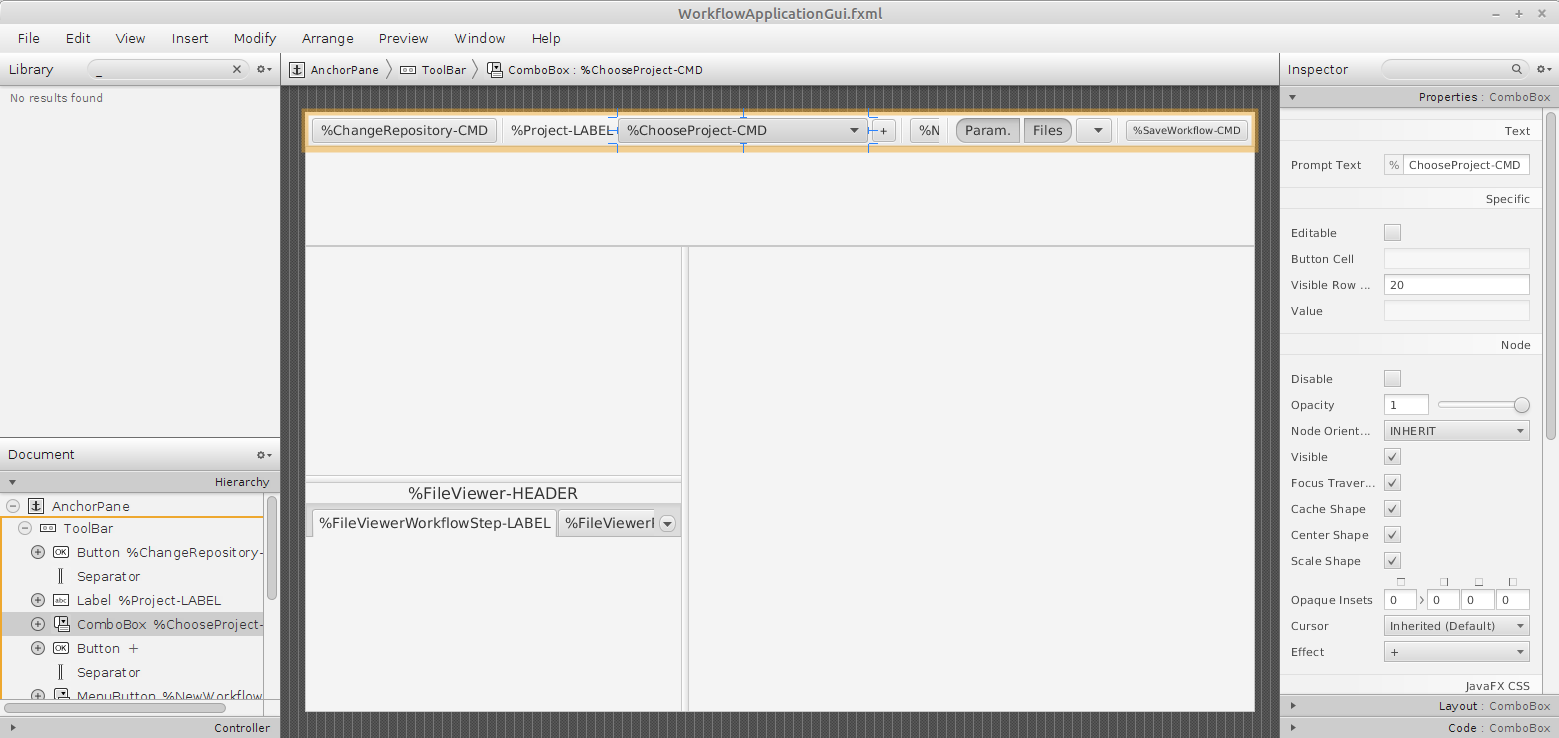
It can be used to modify or extend the SimStadt GUI, and the corresponding .fxml files located in:
building-energy-libs/src/main/resources/eu/simstadt/library/editor/hierarchic-workflow/src/main/resources/de/hftstuttgart/hierarchicworkflow/gui/simstadt/src/main/resources/eu/simstadt/
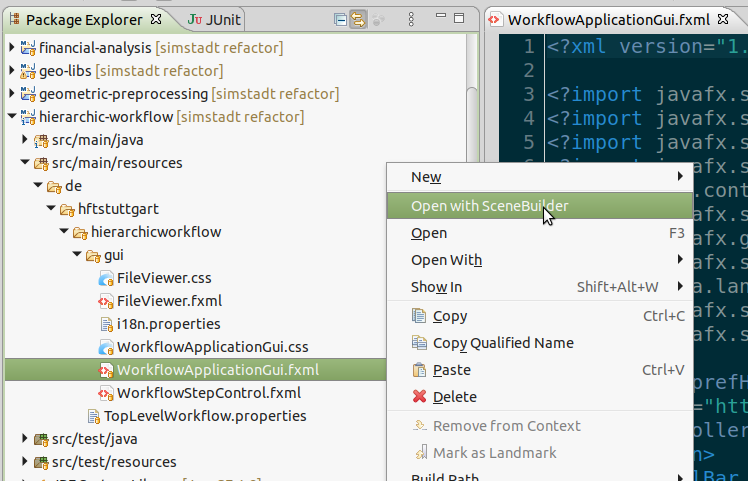
Eclipse plugin
e(fx)clipse is an Eclipse plugin which might help working with fxml files.
Ended: Developer how to
Related softwares ↵
RegionChooser
RegionChooser is a Java project. Its graphical interface allows to extract a specific region from multiple CityGML files and save it as a smaller CityGML file.
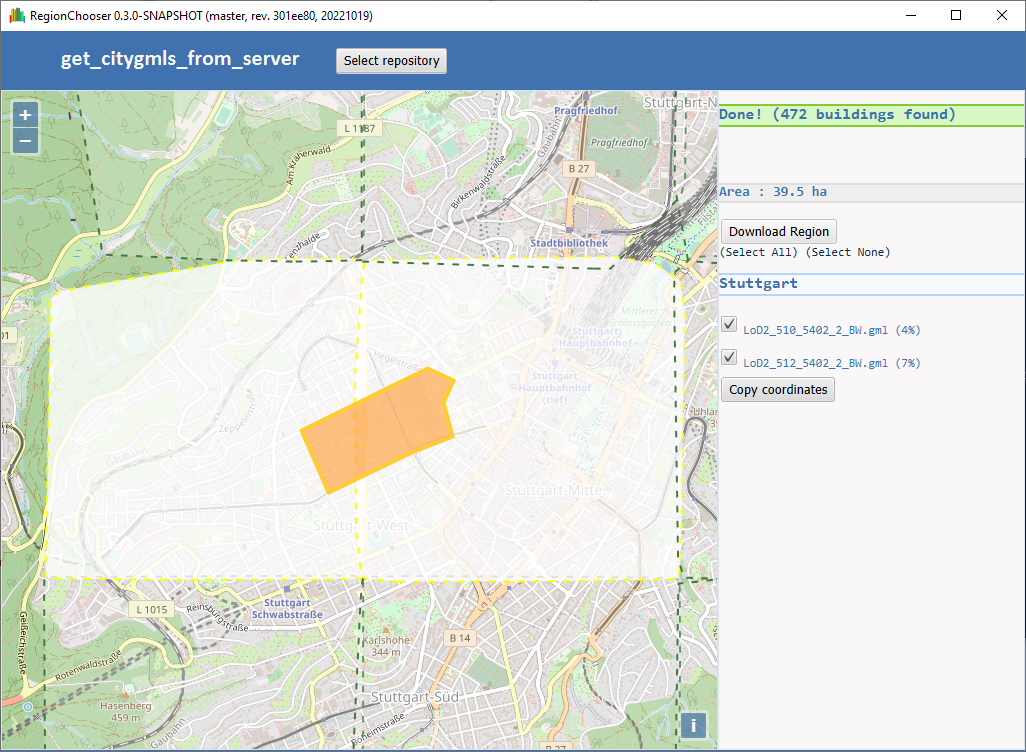
It uses:
- Java 17
- JavaFX
- Openlayers
RegionChooser was developed during SimStadt & SimStadt II projects.
Installation
The easiest way to install RegionChooser is to install SimStadt.
RegionChooser executables are packaged inside SimStadt.zip file.
Usage
Select a repository
You first need to run SimStadt in order to select a repository. Once a repository is selected, SimStadt can be closed.
Start RegionChooser
RegionChooser.batin Windows./RegionChooser.shin Linux./RegionChooser.commandin macOS
Select a region
- Once a repository has been imported, a map should be shown with the convex hulls of the available CityGML files.
- It is possible to define a polygon by clicking repeatedly on the map.
- If an intersection is found with at least one CityGML file, a list of files will be shown on the right.
- The selection might intersect multiple files. The user can select the desired files.
- By clicking on
Download Region, a new CityGML file will be created, by merging the intersections of the polygon with each selected CityGML file.
Get coordinates of polygon
The coordinates of the currently drawn polygon can be exported to WKT by clicking on Copy coordinates. It can be useful for further processing, e.g. in a Python script.
As an example:
POLYGON((9.176194 48.779168, 9.171473 48.775265, 9.176923 48.772890, 9.179842 48.774474, 9.181043 48.774134, 9.183103 48.775661, 9.182073 48.776962, 9.176194 48.779168))
Command-line
RegionChooser can also be called from the command-line:
Launching RegionChooserCLI --help
Usage: region_chooser [-hlV] [--get-hull] [-e=31467] [-o=output.gml]
                      [-w=polygon.wkt] -i=input.gml[,input.gml...] [-i=input.gml
                      [,input.gml...]]...
Extracts a region from one or more citygmls, or calculates the convex hull.
  -i, --input=input.gml[,input.gml...]
                            Citygml files to extract from
  -o, --output=output.gml   Output file
  -e, --epsg=31467          EPSG id for coordinate reference system.
                            Will use the one from input.gml if unspecified.
  -l, --local               Are WKT coordinates in local CRS?
                            Coordinates are in WGS84 if unspecified.
  -w, --wkt=polygon.wkt     File containing WKT polygon, or - for stdin
      --get-hull            Calculate the convex hull of the input CityGML files
  -h, --help                Show this help message and exit.
  -V, --version             Print version information and exit.
As an example:
SimStadt.bat
     --input Grombühl.proj\LoD2_32_566_5516_2_BY.gml,Grombühl.proj\LoD2_32_568_5516_2_BY.gml,Grombühl.proj\LoD2_32_570_5516_2_BY.gml
     --output Grombühl.proj\Grombühl.gml --wkt "POLYGON((9.920858224863567 49.807325539080495, 9.918540796274696 49.79447295986074, 9.992612680429975 49.79358644932381, 9.991926034922162 49.807325539080495, 9.920858224863567 49.807325539080495))"
./SimStadt.sh --get-hull --input example.gml
Development
In order to compile, test and install RegionChooser into your local Maven repository:
git clone https://transfer.hft-stuttgart.de/gitlab/hft_gitlab/regionchooser.git
cd regionchooser
mvn clean install
The RegionChooser jar will then be available to SimStadt for packaging, when a SimStadt+RegionChooser bundle is created.
Author
Eric Duminil, HfT Stuttgart
Contributors
Matthias Betz, HfT Stuttgart
License
Building Physics Library
The Building Physics Library in SimStadt is used in the workflow step PhysicsPreprocessor.
The library contains benchmarking data of building physics properties, constructions and materials, such as the U-values of the different building elements, G-values of the windows, average thermal bridges etc. The standard German Construction Library, based on the data from the Institut für Wohnen und Umwelt (IWU) , is selected by default, but other (customized) libraries may also be chosen, provided that they have been created with the Building Physics Library Editor.
German Building Typology
The IWU (German Institut Wohnen und Umwelt) typology classifies buildings of the German building stock according to their type (e.g. single-family house (SFH), multi-family house (MFH)) and construction period (usually a range of 10 years, e.g. 1958-1968 and 1969-1978). These categories and structure correspond to other typologies for other European countries developed in the TABULA project. For each building type and period, there is a typical archetype building with its respective wall, roof, cellar ceiling and window properties. These properties include typical areas, construction and materials as well as U-values for each component. The different parts of the typology and how they can be edited are described in more detail in the next section.
Figure 1: Overview of the building types and age classes of the German Building Typology by IWU
NYC Building Typology
The One City Built to Last TWG report (2016) defines eight different buildling types which are divided into four residential and four commercial types. They are defined by when they were constructed (pre-war, post-war, post 1980s) and their number of stories (up to seven stories, greater than seven stories). One type is defined by size of floor area.
Figure 2: Overview of the building types of the One City Built to Last Typology
However, the year of construction should not be a way to define the building type in the building physics library. Instead, there should be variants of each building type that is defined by a construction period. In this case there are one to three periods defined for each building type from the following possibilities: all years, before (and including) 1945, after (and including) 1946, 1946-1980, after (and including) 1981. Like this, it is made sure that all possible years of construction are found in each building type. Therefore, there is one additional variant to the ones mentioned above and from the 80x50 report, namely a commercial building, up to 7 stories, post-war.
The building types in the 80x50 report provide specifications (r-values and description) for wall, roof and partly windows. Additionally, there are specific descriptions for typical heating, cooling and domestic hot water systems as well as numbers for lighting and plug loads.
Refurbishment variants have not been added (yet), because the aforementioned report states energy conservation measures without relation to concrete numbers such as r-values. Different scenarios for energy conservation and refurbishment can be added later from other sources.
First, the r-values have to be converted into u-values (U=1/R) and the units have to be changed to the metric system. Every building type is attributed with the respective construction for wall, roof and window. Since there is no information about the ground floor, a u-value of 1.12 is assumed (wooden floor with sand infill). Additional information that is not provided in the report but needed for the SimStadt simulation and the building physics library are window ratio (assumed between 20% and 50%) for each building type. Thermal brigde u-value of 0.1 W/Km², thermal capacity of 90 kJ/Km² and infiltration of 0.6 vol/h are assigned for all building types. The indirectly heated area is assumed to be 0.15. All building types are calculated with an average story height of 3 m.
This information is summarized in an excel table.
The last building type, Commercial, very large, is defined by the minimum floor area of the building. Since this information is not available yet in this workflow step, the minimum gross volume of the building is used instead. The assumption here is that a building with 500,000 square feet corresponds to a building with a minimum volume of 150,000 m³ when the average story height is 3m. This assumption was verified with a dataset of Brooklyn. Additional to the information provided by the building physics library, the building class codes provided by PLUTO are used to assign the proper building type to the buildings. More information can be found in the PLUTO data dictionary.
This is used to differentiate between 1-4 family homes and multifamily homes. The PLUTO building class codes starting with A and B as well as C0, C3, C9 and CM are classified as 1-4 family homes. All PLUTO building class codes starting with E, F, G, I, J, K, L, M, N, O, P, T, U, W, Y, Z as well as R5, R7, R8, RA, RB, RC, RG, RI, RK, RM, RP, RS, RT, RW are defined as commercial. The rest of the PLUTO building class codes consequently are multifamily homes.
Building Physics Library Editor
The Physics Library Editor aims at creating and editing physics libraries which are going to be used in the SimStadt application, and especially in the workflow step "Building Physics Preprocessor", in order to deduce the thermal parameters of the building shell from the building age, type and refurbishment level.
The GUI is made of a left part containing a tree of the building typology, a center part to set the building and shell parameters (in the building category view), manage the variants (in the library view) or the year ranges (in the building type view), and a right part to define the "Constructions" and the "Materials" on their own.
All the following examples and explanations are made based on the German Building Typology.
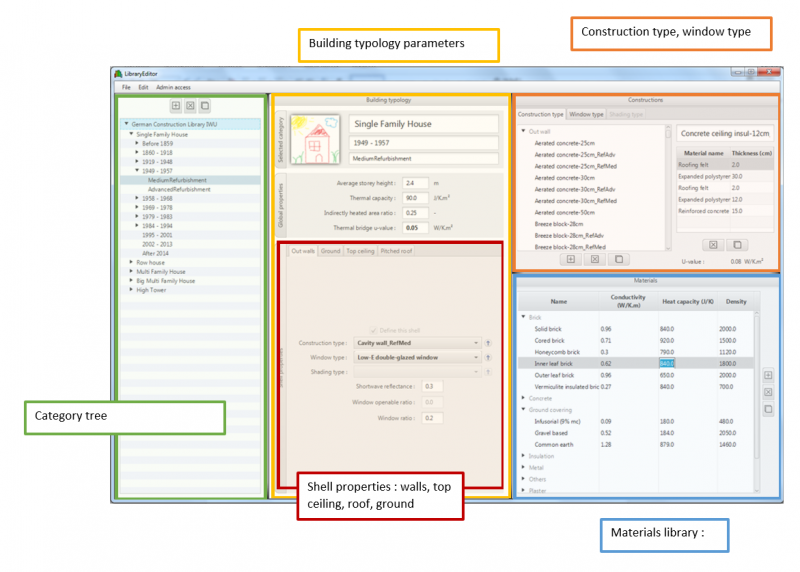
Figure 3: Physics Library Editor GUI Overview with the building category view in the center part
The Physics Library Editor is a standalone application and can be used without the SimStadt application. With this editor, country-specific parameters defined in the EU project Tabula have been registered.
Menu
The file menu allows to create a new library (individual libraries can be imported either from a file (.xml file corresponding to the right xml schema) or can be modified versions of the standard library.), to import one, or to use the standard library included in the Physics Library Editor (up to now (01/01/2020, there are two standard libraries included: the German Building Typology and the NYC Building Typology, described above (here link to section above). The construction, window, shading and material libraries contained in a physics library are also imported when importing it, but they can also be imported separately with the partial import item.
The Edit menu allows to undo/redo some actions like the modification of the building parameters.
The Admin access menu allows to remove the protection of some libraries which prevents to edit them. For example, the standard German Construction Library IWU is protected. The word "unlock" must be typed in the text field of the menu to remove the protection of the selected library (in the left part).
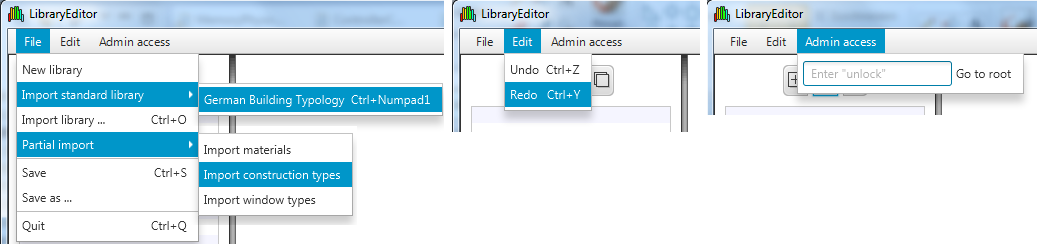
Figure 4: Menus of Building Physics Library
To save a library, after clicking on the "Save as..." item, the library must be selected in the popup and after clicking on the "Save as..." button of this pop-up, a file chooser pops-up where one can choose the folder to save the library. If the library is invalid, i.e. cannot be used in SimStadt Application because some parameters are missing, then the list of the missing parameters will pop up after the library is saved
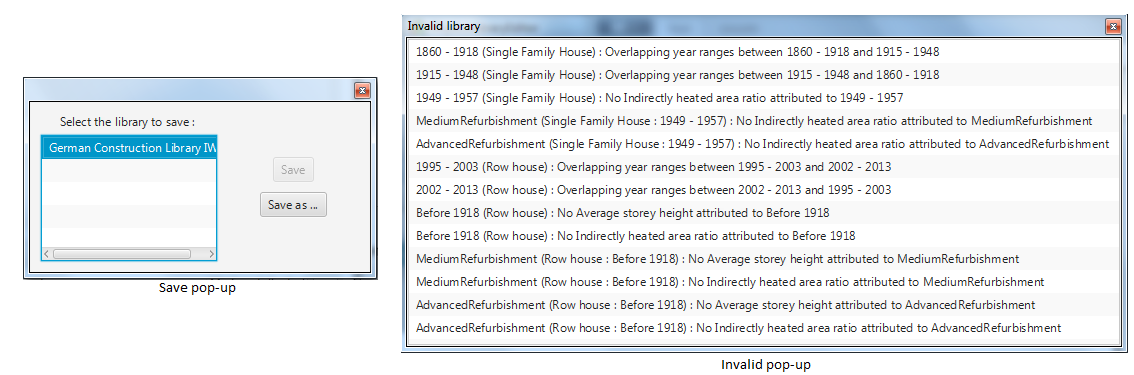
Figure 5: Save and invalid pop-ups
Category Tree
It shows all the opened libraries, as well as their building types, year ranges and variants. They can be hidden or not, as per convenience.
If the library is not protected, the names of the library, its building types, year ranges and variants can be modified. Libraries, building types, year ranges and variants can also be added, copied and removed by opening the library, building type, year range or variant menus. Removing a variant will remove it only from the corresponding year range, the variant won't be deleted from the library's variants' list. On the contrary, adding a variant if the corresponding year range already has all the variants of the library will add a new variant to the library's list. If the year range does not have all the variants of the library, then the variant added will be the first variant of the library list that the usage type does not have.
The add button above the table allows to add a new library, the copy and delete buttons allow to copy or delete the selected item in the table (either a library, building type, year range or variant).
In this tree, there can also be some warning icons if the library is not valid, i.e. if it cannot be used in SimStadt Application because some parameters are missing. The warning icons are on the same line as the building types which have missing data. Moving the mouse on the icon will show the list of the missing parameters.
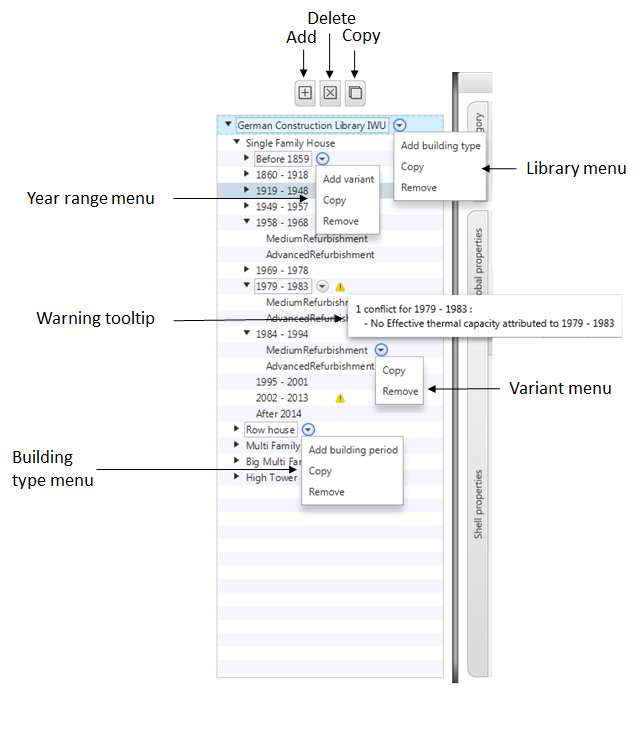
Figure 6: Category Tree of Building Physics Library
Library View
Here, the name, description and source(s) of a library can be modified. A checkbox indicates if the library is protected or not, and a button allows to check if the library is valid or not, and then to show a window containing all the missing parameters. There is also the table listing all the variants of the library.
The variants table contains all the variants of the library. A variant of a year range corresponds to the same building type but does not have the same physics parameters. One can add, delete and copy a variant with the buttons on the right. Variants are global, which means that they can be used for all the year ranges. Therefore, adding a variant to a year range (in the category tree) will add the first variant of the library list that the year range does not have. Removing a variant from the variants table will remove it from all the buliding types.
Building Type View
Here, the name and the ID of the building type can be modified. Year ranges of the building type can be added, modified and deleted. The year ranges must not overlap, otherwise the library is invalid and cannot be used in SimStadt Application.
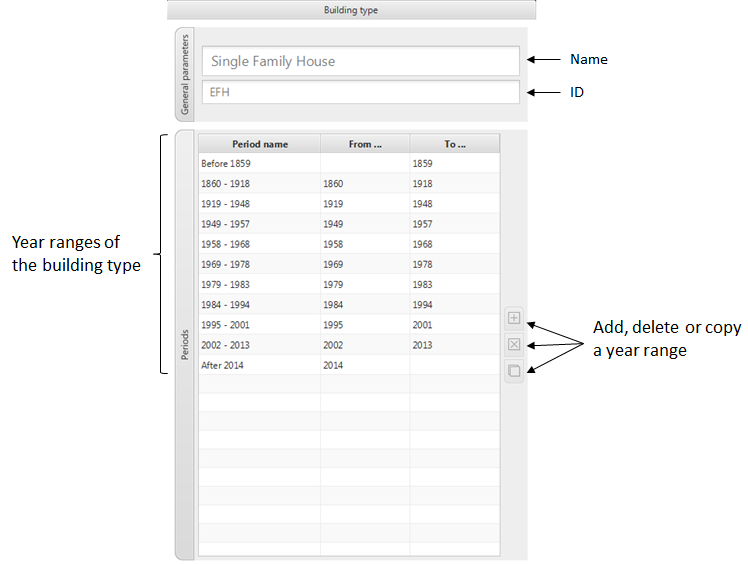
Figure 7: Buliding type view
Category View
Here, the parameters of a year range or of a variant can be edited. The upper part contains information about the selected category: building type, year range, and the variant name if the current category is a variant.
In the center part, the global properties (average storey height, thermal capacity, indirectly heated area ratio and U-value) can be modified.
In the lower part, the shell properties for each building component can be edited. There are four tabs, one for each type of shell. Some buildings don't have a top ceiling or a pitched roof, then the check-box "Non-existent shell properties" can be ticked. The construction, window and shading type choice-boxes allow to choose between one of the types of the construction, window and shading type libraries. These types can be edited in the construction pane, in the upper right part of the GUI (see constructions pane for more details). The inherit buttons allow to set the same construction/window/shading type as the parent category (year range for a variant, and building type for a year range). As there is no opening on a ground, the opening panel is disabled in the ground tab.
By default, a variant has the same parameters as the related year range. If a parameter is different, then it is bold.
There is a space left to add a picture of a typical building of the year range. In order to add such pictures, a zip file containing the pictures must be added in the same folder where the library xml file is. Its name must be the same, except that it must ends with "_Images.zip" instead of ".xml". Inside, the name of the picture corresponding to a year range must be : IdOfTheBuildingType + "." + numberOfTheYearRange + ".png"
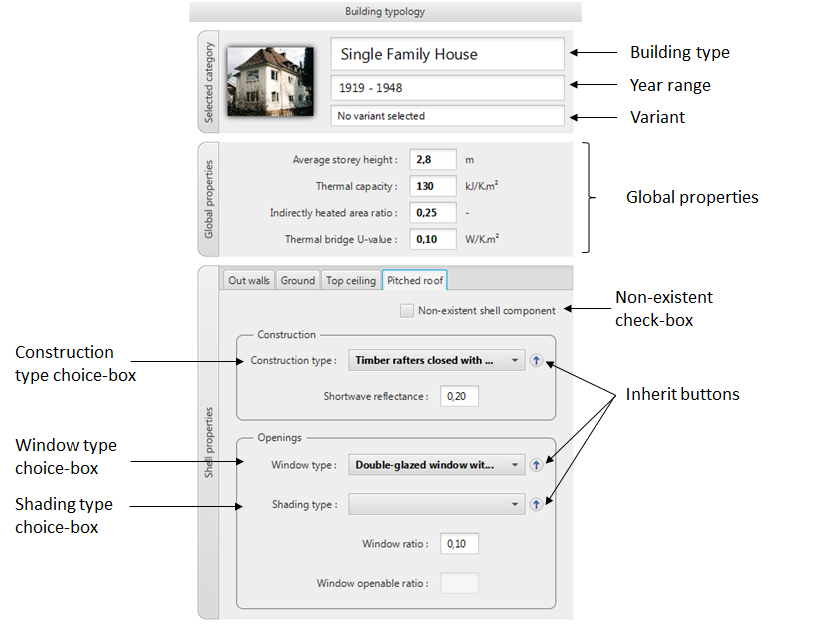
Figure 8: Buliding category view
Construction Pane
In this pane, the construction, window and shading libraries can be edited. It can be maximized in a pop-up by clicking on the maximize button.
In the construction tab, constructions types can be created, modified or deleted. A construction type must belong to one of the following categories : out wall, ground shell, pitched roof and top ceiling. A construction type can be created by clicking on the add button. Then, when clicking on the construction type, its name appears in the textfield on the right, and the different materials it is made of, as well as their thickness appear in the table on the right. New materials can be added by drag-and-drop from the material pane (See Material Pane for further details on the materials). The U-value of the shell is automatically computed.
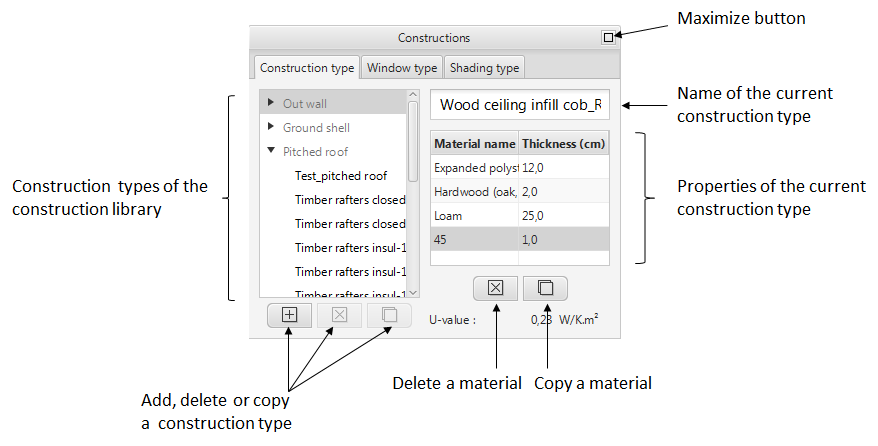
Figure 9: Construction tab
In the window tab, window types can be created, modified and deleted. When clicking on a window type, the text fields on the right are set to its parameters, and they can thus be edited.
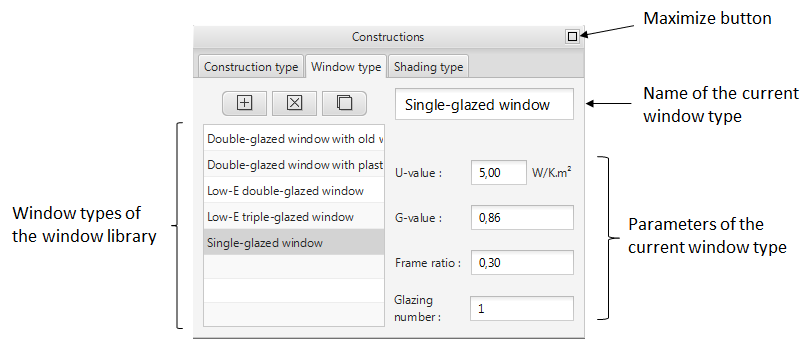
Figure 10: Window tab
In the shading tab, shading types can be created, modified and deleted. When clicking on a shading type, the text fields and radio buttons on the right are set to its parameters, and they can thus be edited.
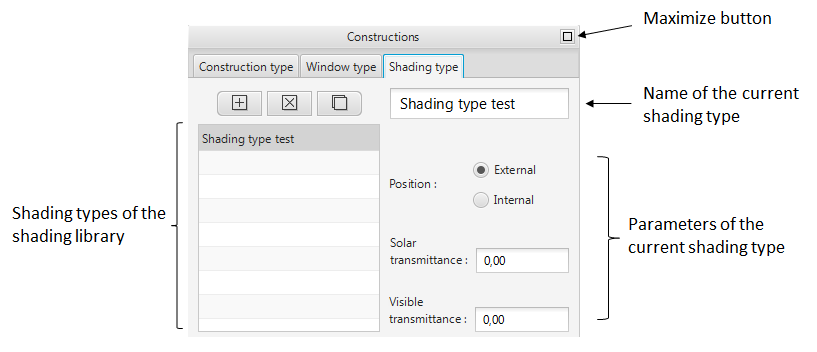
Figure 11: Shading tab
Material Pane
In this pane, the material library can be edited. New materials can be created, and the existing ones can be modified. A material must belong to one of the following categories : brick, concrete, ground covering, insulation, metal, others, plaster, stone, tile and wood. A material is defined by its conductivity, heat capacity and density which can be edited in the corresponding columns.
The materials are used in the construction types, therefore a material can be dragged and dropped to the table in the right of the construction tab in the construction pane to add it to the current construction type.
The material pane can be maximized in a pop-up by clicking on the maximize button.
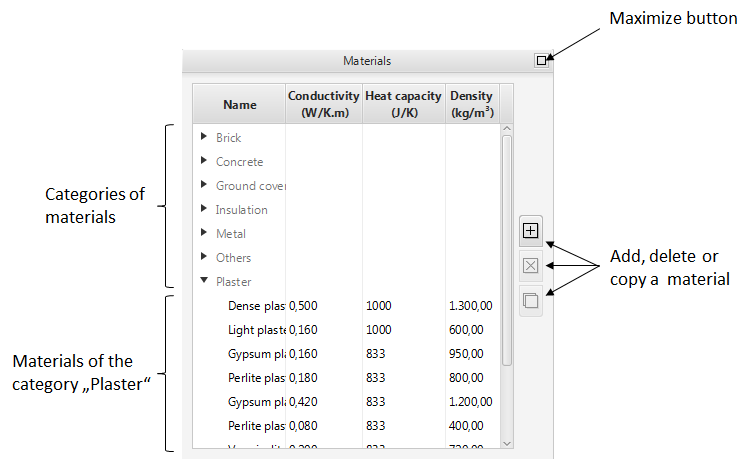
Figure 12: Material pane
Screencast
Sources
Building Usage Library
UsageLibraryEditor is a program included with SimStadt.
With it, it is possible to define set-point temperatures, inner gains and occupation for different building functions (e.g. residential, office, hotel, retail, ...).
This information is processed in Usage Preprocessor, which is then used in Monthly Energy Balance.
Source
For Germany, the table has been compiled from:
- DIN 18599-10
- VDI 3807-2
- VDI 2089.1
- VDI 4655
- "Architect Registration Exam Review Manual" Section 6, Chapter 27
- BMVBS: "Bekanntmachung der Regeln für Energieverbrauchskennwerte und der Vergleichswerte im Nichtwohngebäudebestand"
- "Über Örtlicher BetriebsVergleich Bäderbetriebe (ÜÖBV) Teil II" Deutsche Gesellschaft für das Badewesen e.V.
- EnergieAgentur NRW
GUI
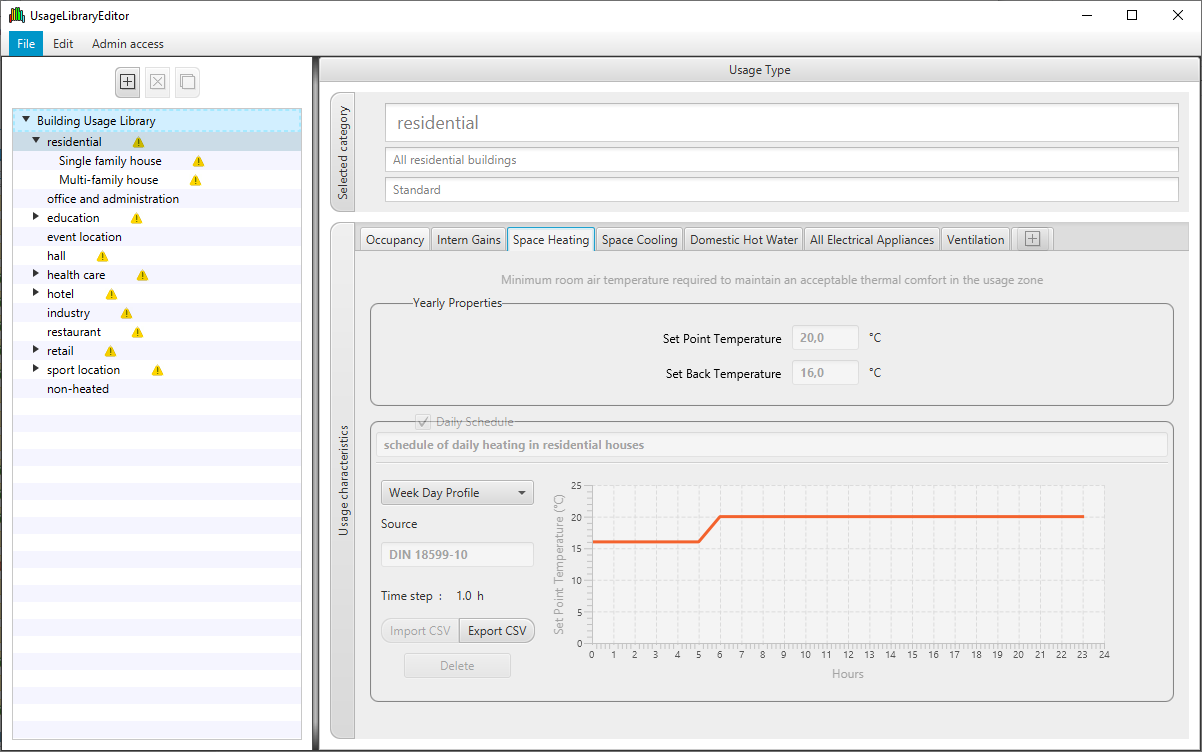
Screencast
QGIS
QGIS is a free and open-source cross-platform desktop geographic information system (GIS) application that supports viewing, editing, and analysis of geospatial data.
It can be used to display maps, 3D buildings or simulation results, for example from CSV files output by SimStadt.
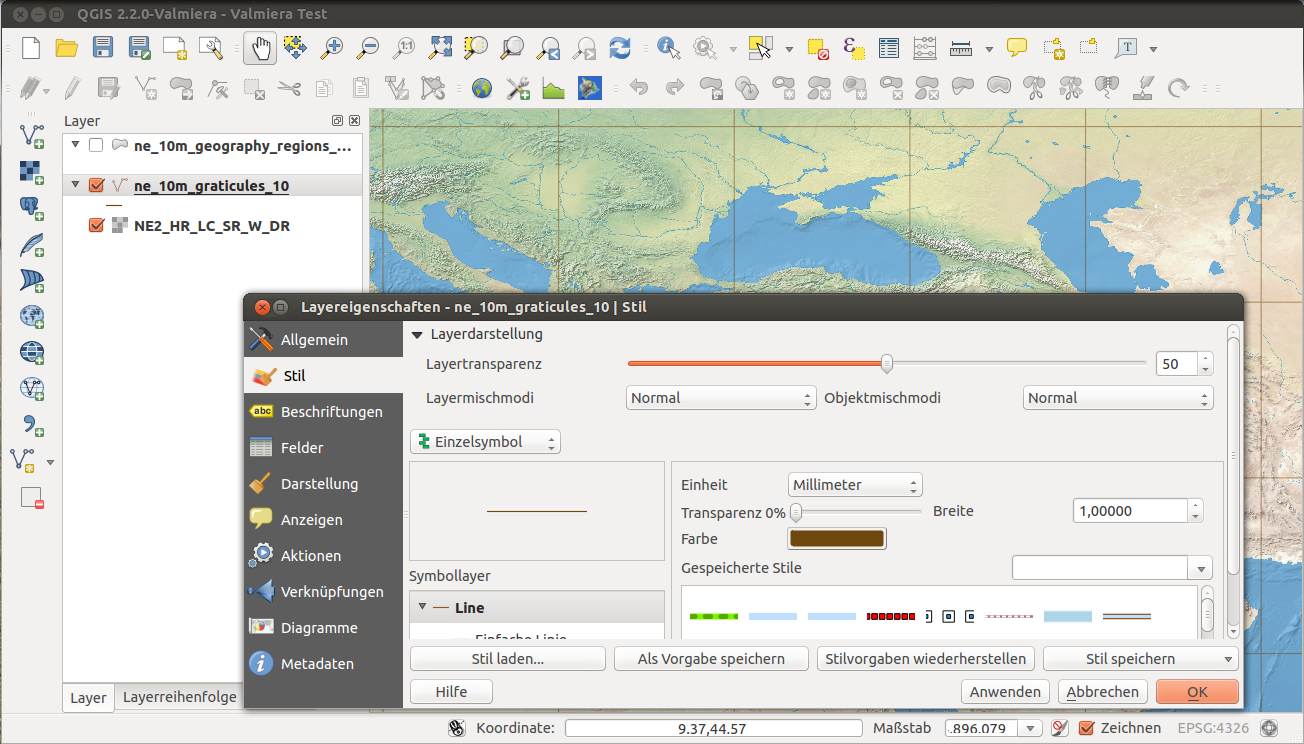
CityGMLViewer
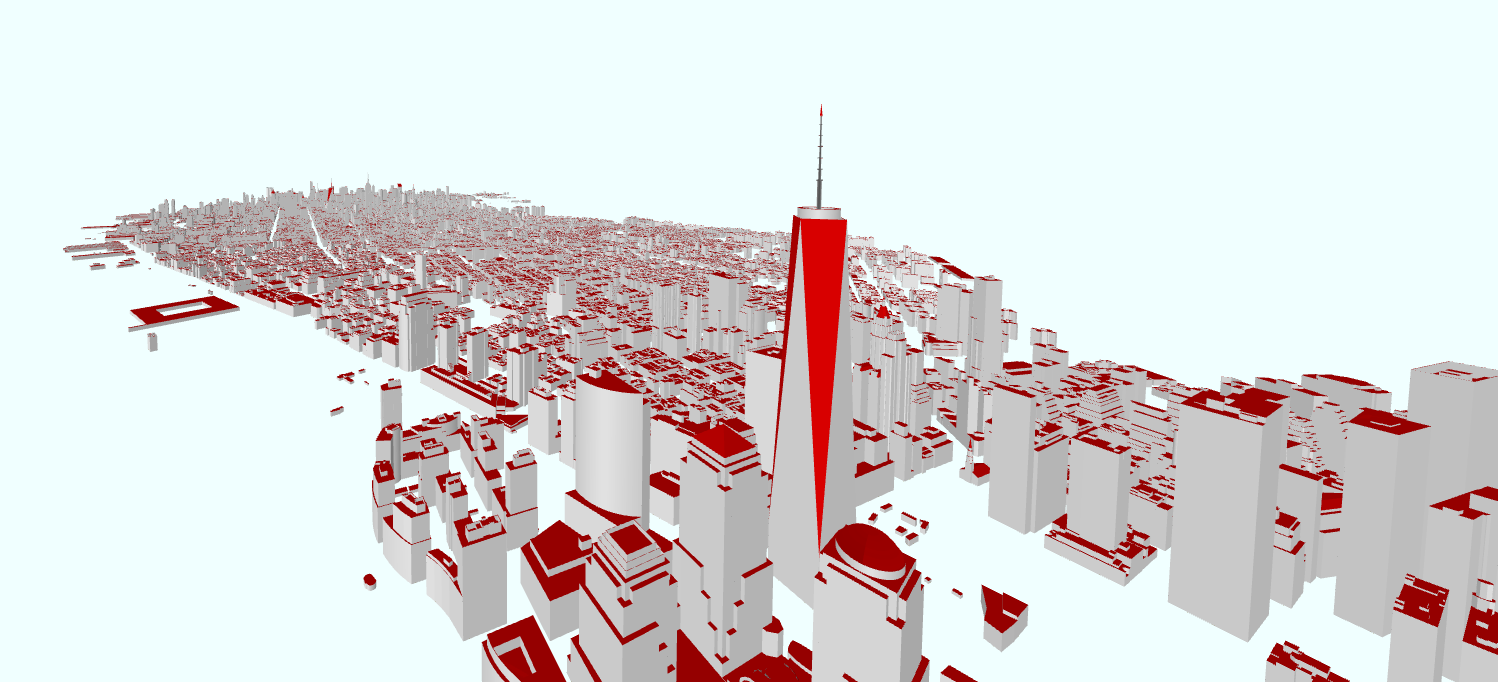
CityGMLViewer is, as the name implies, a CityGML viewer. It is based on OpenGL, and was developed by Matthias Betz at HfT Stuttgart.
Browser Version
CityGMLViewer JS runs in browsers, and simply requires JavaScript. It does not upload the CityGML file anywhere, it simply loads it and displays it locally.
The project is hosted on HfT Gitlab, and is released under AGPLv3.
Desktop Version
CityGMLViewer Desktop works on Windows and Linux. It requires Java 17.
It can display CityGML 2 and 3, and can show larger files than FZKViewer.
Here's the most recent version (v0.0.2). It is released under Apache License 2.0.
There's a start.bat script inside the zip file, which can be executed on Windows, and a start.sh for Linux.
As an alternative, you can also download the code and compile it yourself:
git clone https://transfer.hft-stuttgart.de/gitlab/citygml/citygmlviewer.git
cd citygmlviewer
mvn package
Web-SimStadt
Web-SimStadt is a web application written in JRuby on Rails. It uses the same compiled Jars as the SimStadt desktop version, and was developed during SimStadt 1 and SimStadt 2 projects.
It lets the user pick a project, a CityGML file and a workflow:
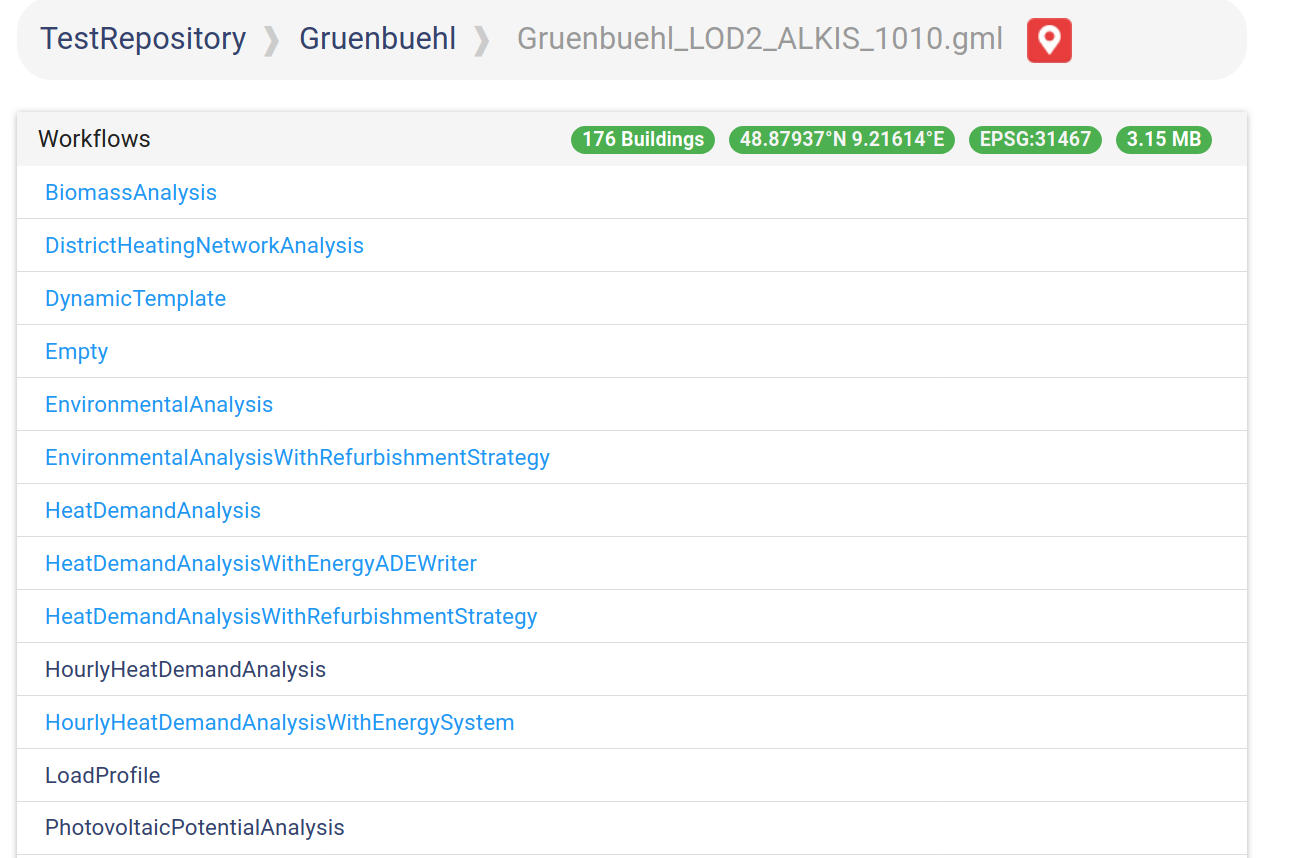
and then runs the workflow and displays the corresponding results:
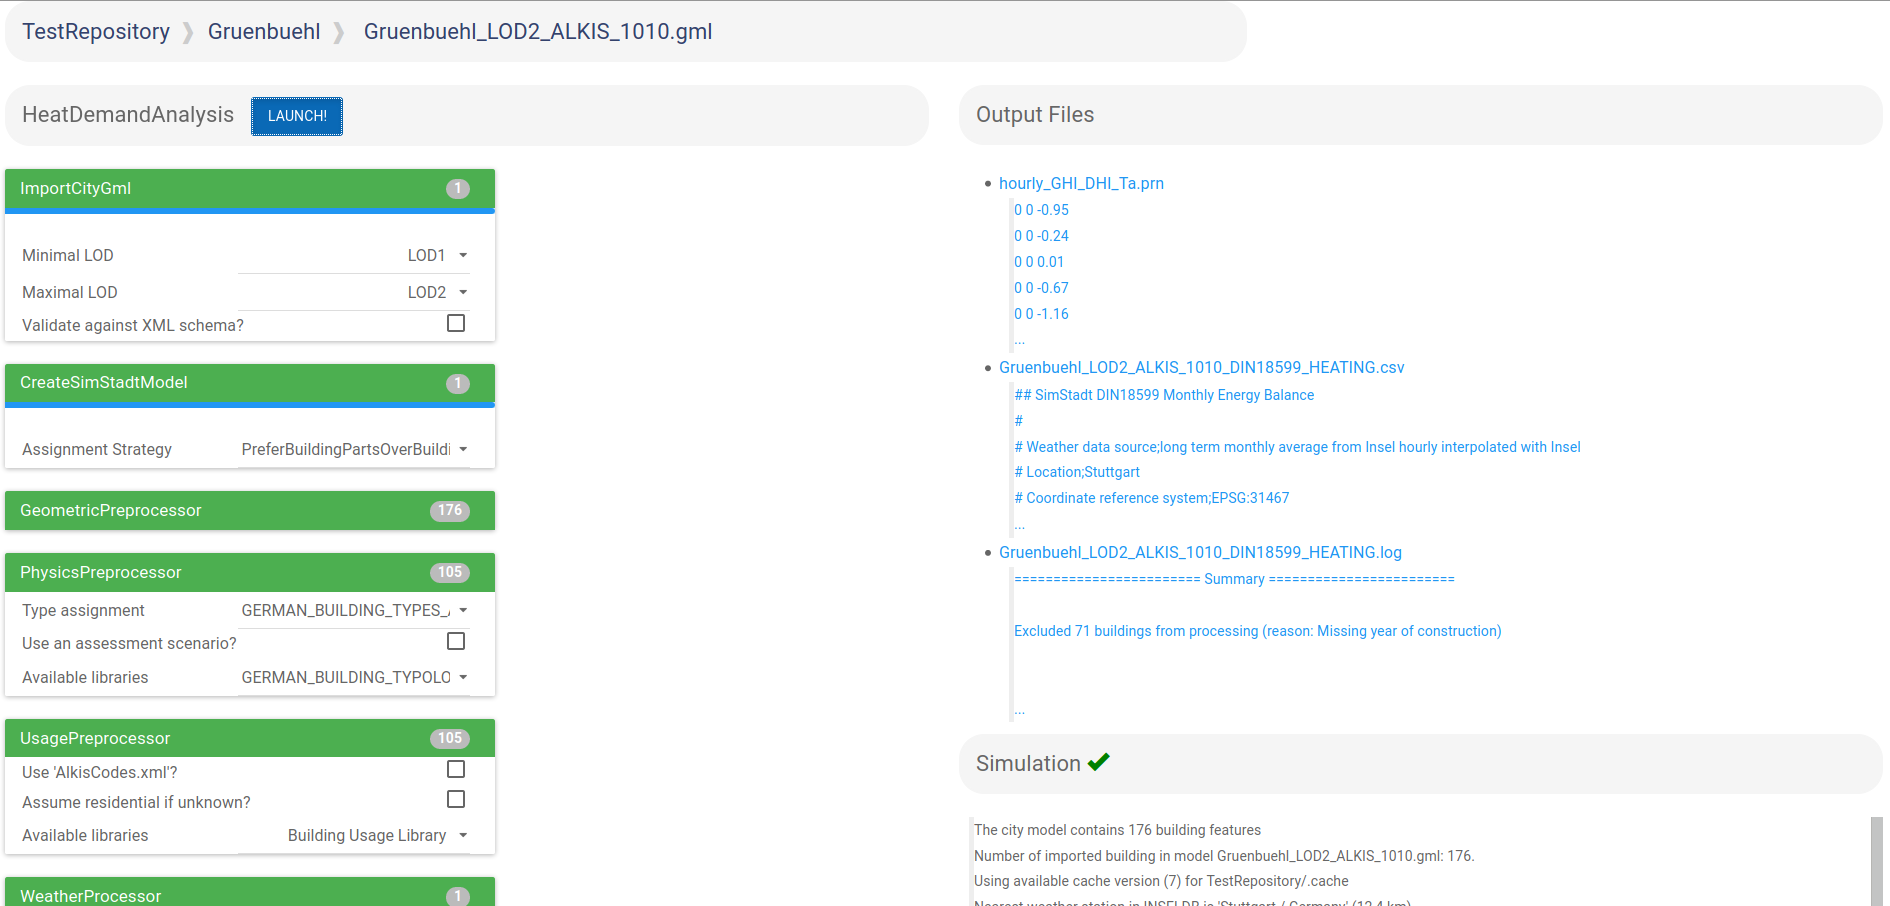
It is not available for public use yet, but might be open-sourced in the future, and be offered as a virtual machine or a container.
SketchUp
![]()
SketchUp is a 3D modeling computer program for a wide range of drawing applications such as architectural, interior design, landscape architecture, civil and mechanical engineering, film and video game design.
SketchUp Make (as opposed to Pro) should be enough in order to export CityGML models. A license is only required for commercial use. 2017 is also the last version which should work correctly with old graphics cards.
GEORES Plugin
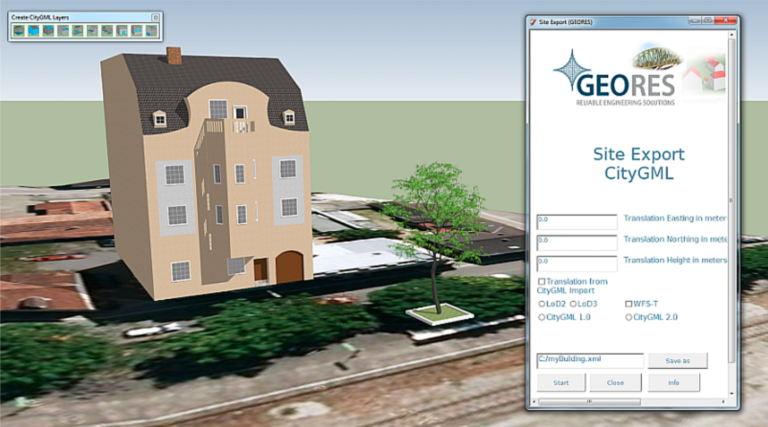
It is possible to import/export CityGML files in SketchUp thanks to GEORES plugin:
The GEORES SketchUp CityGML Plugin allows to import and export CityGML files. It also provides functionalities to annotate meshes and faces with the according CityGML classes and attributes. The code has originally been developed by Wolfgang Sach and distributed by his company GEORES. In 2018, Wolfgang stopped development on the project and released the code as open source. Since 2019, the GEORES Plugin is free to use and released under the MIT license.
Code and installer are available on GitHub/GeoplexGIS/geores. (mirror)
It is also possible to add buildings to an existing CityGML file.
Ended: Related softwares
Documentation help ↵
Markdown cheatsheet
Markdown is a lightweight markup language for creating formatted text using a plain-text editor. John Gruber and Aaron Swartz created Markdown in 2004 as a markup language that is appealing to human readers in its source code form. Markdown is widely used in blogging, instant messaging, online forums, collaborative software, documentation pages, and readme files.
Footnotes
Lorem ipsum[^1] dolor sit amet, consectetur adipiscing elit.[^2]
Lorem ipsum1 dolor sit amet, consectetur adipiscing elit.2
Keys
++ctrl+alt+delete++
Ctrl+Alt+Del
Emojis
See emoji list
:warning: :construction: :de: :us: :round_pushpin: :arrow_forward: :exclamation: :earth_africa: :question:
:grin: :-1: :+1: :shit: :see_no_evil: :telescope:


Biomass :evergreen_tree:

Photovoltaic :sunny:

Heat Demand :house:
Biomass 
Photovoltaic 
Heat Demand 
Symbols
(c) Zafh.net 2019

+/-

-->
1/4
2/3

https://hft-stuttgart.de
© Zafh.net 2019
±
→ ¼ ⅔
Blocks
??? success "Just a test"
    Lorem ipsum dolor sit amet, consectetur adipiscing elit. Nulla et euismod
    nulla. Curabitur feugiat, tortor non consequat finibus, justo purus auctor
    massa, nec semper lorem quam in massa.
Just a test
Lorem ipsum dolor sit amet, consectetur adipiscing elit. Nulla et euismod nulla. Curabitur feugiat, tortor non consequat finibus, justo purus auctor massa, nec semper lorem quam in massa.
???+ warning "OHLALA"
    Lorem ipsum dolor sit amet, consectetur adipiscing elit. Nulla et euismod
    nulla. Curabitur feugiat, tortor non consequat finibus, justo purus auctor
    massa, nec semper lorem quam in massa.
OHLALA
Lorem ipsum dolor sit amet, consectetur adipiscing elit. Nulla et euismod nulla. Curabitur feugiat, tortor non consequat finibus, justo purus auctor massa, nec semper lorem quam in massa.
???+ danger "BOUM!"
    Lorem ipsum dolor sit amet, consectetur adipiscing elit. Nulla et euismod
    nulla. Curabitur feugiat, tortor non consequat finibus, justo purus auctor
    massa, nec semper lorem quam in massa.
BOUM!
Lorem ipsum dolor sit amet, consectetur adipiscing elit. Nulla et euismod nulla. Curabitur feugiat, tortor non consequat finibus, justo purus auctor massa, nec semper lorem quam in massa.
Also available are:
info
tip
note
abstract
bug
example
fail
quote
question
https://squidfunk.github.io/mkdocs-material/reference/admonitions/ for more info.
Headings
Headings from h1 through h6 are constructed with a # for each level. There should only be one h1, at the very beginning of the markdown file.
## h2 Heading
### h3 Heading
#### h4 Heading
##### h5 Heading
###### h6 Heading
Renders to:
h2 Heading
h3 Heading
h4 Heading
h5 Heading
h6 Heading
Paragraphs
Body copy written as normal plain-text will be wrapped with <p></p> tags in the rendered HTML.
So this:
Lorem ipsum dolor sit amet, graecis denique ei vel, at duo primis mandamus. Et legere ocurreret pri, animal tacimates complectitur ad cum. Cu eum inermis inimicus efficiendi. Labore officiis his ex, soluta officiis concludaturque ei qui, vide sensibus vim ad.
Renders to this:
Lorem ipsum dolor sit amet, graecis denique ei vel, at duo primis mandamus. Et legere ocurreret pri, animal tacimates complectitur ad cum. Cu eum inermis inimicus efficiendi. Labore officiis his ex, soluta officiis concludaturque ei qui, vide sensibus vim ad.
Breaks
You can use multiple consecutive newline characters (\n) to create extra spacing between sections in a markdown document. However, if you need to ensure that extra newlines are not collapsed, you can use as many HTML <br> elements as you want.
Horizontal Rule
The HTML <hr> element is for creating a "thematic break" between paragraph-level elements. In markdown, you can use of the following for this purpose:
___: three consecutive underscores---: three consecutive dashes***: three consecutive asterisks
Renders to:
Emphasis
Bold
For emphasizing a snippet of text with a heavier font-weight.
The following snippet of text is rendered as bold text.
**rendered as bold text**
rendered as bold text
Italics
For emphasizing a snippet of text with italics.
The following snippet of text is rendered as italicized text.
_rendered as italicized text_
renders to:
rendered as italicized text
Blockquotes
Used for defining a section of quoting text from another source, within your document.
To create a blockquote, use > before any text you want to quote.
> Lorem ipsum dolor sit amet, consectetur adipiscing elit. Integer posuere erat a ante
Renders to:
Lorem ipsum dolor sit amet, consectetur adipiscing elit. Integer posuere erat a ante.
Blockquotes can also be nested:
> Donec massa lacus, ultricies a ullamcorper in, fermentum sed augue.
Nunc augue augue, aliquam non hendrerit ac, commodo vel nisi.
>> Sed adipiscing elit vitae augue consectetur a gravida nunc vehicula. Donec auctor
odio non est accumsan facilisis. Aliquam id turpis in dolor tincidunt mollis ac eu diam.
>>> Donec massa lacus, ultricies a ullamcorper in, fermentum sed augue.
Nunc augue augue, aliquam non hendrerit ac, commodo vel nisi.
Renders to:
Donec massa lacus, ultricies a ullamcorper in, fermentum sed augue. Nunc augue augue, aliquam non hendrerit ac, commodo vel nisi.
Sed adipiscing elit vitae augue consectetur a gravida nunc vehicula. Donec auctor odio non est accumsan facilisis. Aliquam id turpis in dolor tincidunt mollis ac eu diam.
Donec massa lacus, ultricies a ullamcorper in, fermentum sed augue. Nunc augue augue, aliquam non hendrerit ac, commodo vel nisi.
Lists
Unordered
A list of items in which the order of the items does not explicitly matter.
You may use any of the following symbols to denote bullets for each list item:
* valid bullet
- valid bullet
+ valid bullet
For example
+ Lorem ipsum dolor sit amet
+ Consectetur adipiscing elit
+ Integer molestie lorem at massa
+ Facilisis in pretium nisl aliquet
+ Nulla volutpat aliquam velit
    - Phasellus iaculis neque
    - Purus sodales ultricies
    - Vestibulum laoreet porttitor sem
    - Ac tristique libero volutpat at
+ Faucibus porta lacus fringilla vel
+ Aenean sit amet erat nunc
+ Eget porttitor lorem
- Lorem ipsum dolor sit amet
- Consectetur adipiscing elit
- Integer molestie lorem at massa
- Facilisis in pretium nisl aliquet
- Nulla volutpat aliquam velit
- Phasellus iaculis neque
- Purus sodales ultricies
- Vestibulum laoreet porttitor sem
- Ac tristique libero volutpat at
- Faucibus porta lacus fringilla vel
- Aenean sit amet erat nunc
- Eget porttitor lorem
Ordered
A list of items in which the order of items does explicitly matter.
1. Lorem ipsum dolor sit amet
2. Consectetur adipiscing elit
3. Integer molestie lorem at massa
4. Facilisis in pretium nisl aliquet
5. Nulla volutpat aliquam velit
6. Faucibus porta lacus fringilla vel
7. Aenean sit amet erat nunc
8. Eget porttitor lorem
- Lorem ipsum dolor sit amet
- Consectetur adipiscing elit
- Integer molestie lorem at massa
- Facilisis in pretium nisl aliquet
- Nulla volutpat aliquam velit
- Faucibus porta lacus fringilla vel
- Aenean sit amet erat nunc
- Eget porttitor lorem
Time-saving Tip
Sometimes lists change, and when they do it's a pain to re-order all of the numbers. Markdown solves this problem by allowing you to simply use 1. before each item in the list.
For example:
1. Lorem ipsum dolor sit amet
1. Consectetur adipiscing elit
1. Integer molestie lorem at massa
1. Facilisis in pretium nisl aliquet
1. Nulla volutpat aliquam velit
1. Faucibus porta lacus fringilla vel
1. Aenean sit amet erat nunc
1. Eget porttitor lorem
Automatically re-numbers the items and renders to:
- Lorem ipsum dolor sit amet
- Consectetur adipiscing elit
- Integer molestie lorem at massa
- Facilisis in pretium nisl aliquet
- Nulla volutpat aliquam velit
- Faucibus porta lacus fringilla vel
- Aenean sit amet erat nunc
- Eget porttitor lorem
Code
Inline code
Wrap inline snippets of code with a single backtick: `.
For example, to show <div></div> inline with other text, just wrap it in backticks.
For example, to show `<div></div>` inline with other text, just wrap it in backticks.
"Fenced" code block
Three consecutive backticks, referred to as "code fences", are used to denote multiple lines of code: ```.
For example, this:
Example text here...
Appears like this when viewed in a browser:
Example text here...
And renders to something like this in HTML:
Indented code
You may also indent several lines of code by at least four spaces, but this is not recommended as it is harder to read, harder to maintain, and doesn't support syntax highlighting.
Example:
    // Some comments
    line 1 of code
    line 2 of code
    line 3 of code
// Some comments
line 1 of code
line 2 of code
line 3 of code
Syntax highlighting
Various markdown parsers, such as remarkable, support syntax highlighting with fenced code blocks. To activate the correct styling for the language inside the code block, simply add the file extension of the language you want to use directly after the first code "fence": ```js, and syntax highlighting will automatically be applied in the rendered HTML (if supported by the parser). For example, to apply syntax highlighting to JavaScript code:
grunt.initConfig({
  assemble: {
    options: {
      assets: 'docs/assets',
      data: 'src/data/*.{json,yml}',
      helpers: 'src/custom-helpers.js',
      partials: ['src/partials/**/*.{hbs,md}']
    },
    pages: {
      options: {
        layout: 'default.hbs'
      },
      files: {
        './': ['src/templates/pages/index.hbs']
      }
    }
  }
});
Which renders to:
grunt.initConfig({
  assemble: {
    options: {
      assets: 'docs/assets',
      data: 'src/data/*.{json,yml}',
      helpers: 'src/custom-helpers.js',
      partials: ['src/partials/**/*.{hbs,md}']
    },
    pages: {
      options: {
        layout: 'default.hbs'
      },
      files: {
        './': ['src/templates/pages/index.hbs']
      }
    }
  }
});
Links
Autolinks
Autolinks are absolute URIs and email addresses inside < and >. They are parsed as links, where the URI or email address itself is used as the link's label.
<http://example.com>
Renders to:
URIs or email addresses that are not wrapped in angle brackets are not recognized as valid autolinks by markdown parsers.
Inline links
[Assemble](http://assemble.io){target=_blank}
Renders to (hover over the link, there is no tooltip):
Link titles
[Upstage](https://github.com/upstage/ "Visit Upstage!"){target=_blank}
Renders to (hover over the link, there should be a tooltip):
Named Anchors
Named anchors enable you to jump to the specified anchor point on the same page. For example, each of these chapters:
# Table of Contents
  * [Chapter 1](#chapter-1)
  * [Chapter 2](#chapter-2)
  * [Chapter 3](#chapter-3)
will jump to these sections:
## Chapter 1 <a name="chapter-1"></a>
Content for chapter one.

## Chapter 2 <a name="chapter-2"></a>
Content for chapter one.

## Chapter 3 <a name="chapter-3"></a>
Content for chapter one.
Anchor placement
Note that placement of achors is arbitrary, you can put them anywhere you want, not just in headings. This makes adding cross-references easy when writing markdown.
Images
Images have a similar syntax to links but include a preceding exclamation point.

![]()
or
{target=_blank, style="height:200px;width:200px"}

or

Like links, Images also have a footnote style syntax
![Alt text][id]

With a reference later in the document defining the URL location:
[id]: http://octodex.github.com/images/dojocat.jpg "The Dojocat"
Raw HTML
Any text between < and > that looks like an HTML tag will be parsed as a raw HTML tag and rendered to HTML without escaping.
(Note that no attempt is made by the markdown parser to validate your HTML).
Example:
**Visit <a href="https://github.com">Jon Schlinkert's GitHub Profile</a>.**
Renders to:
Visit Jon Schlinkert's GitHub Profile.
Escaping with backslashes
Any ASCII punctuation character may be escaped using a single backslash.
Example:
\*this is not italic*
Renders to:
*this is not italic*
Non-standard features
The following markdown features are not defined by the CommonMark specification, but they are commonly supported by markdown parsers and editors, as well as sites like GitHub and GitLab.
Strikethrough
In GFM you can do strickthroughs.
~~Strike through this text.~~
Strike through this text.
Todo List
- [ ] Lorem ipsum dolor sit amet
- [X] Consectetur adipiscing elit
- [ ] Integer molestie lorem at massa
Renders to:
- Lorem ipsum dolor sit amet
- Consectetur adipiscing elit
- Integer molestie lorem at massa
Links in todo lists
- [ ] [foo](#autolinks)
- [X] [baz](#inline-links)
- [ ] [fez](#link-titles)
Renders to:
Tables
Tables are created by adding pipes as dividers between each cell, and by adding a line of dashes (also separated by bars) beneath the header (this line of dashes is required).
- pipes do not need to be vertically aligned.
- pipes on the left and right sides of the table are sometimes optional
- three or more dashes must be used for each cell in the separator row
Example:
| Option | Description |
| ------ | ----------- |
| data   | path to data files to supply the data that will be passed into templates. |
| engine | engine to be used for processing templates. Handlebars is the default. |
| ext    | extension to be used for dest files. |
Renders to:
| Option | Description |
|---|---|
| data | path to data files to supply the data that will be passed into templates. |
| engine | engine to be used for processing templates. Handlebars is the default. |
| ext | extension to be used for dest files. |
Aligning cells
Center text in a column
To center the text in a column, add a colon to the middle of the dashes in the row beneath the header.
| Option | Description |
| -:- | -:- |
| data   | path to data files to supply the data that will be passed into templates. |
| engine | engine to be used for processing templates. Handlebars is the default. |
| ext    | extension to be used for dest files. |
| Option | Description |
|---|---|
| data | path to data files to supply the data that will be passed into templates. |
| engine | engine to be used for processing templates. Handlebars is the default. |
| ext | extension to be used for dest files. |
Right-align the text in a column
To right-align the text in a column, add a colon to the middle of the dashes in the row beneath the header.
| Option | Description |
| ------:| -----------:|
| data   | path to data files to supply the data that will be passed into templates. |
| engine | engine to be used for processing templates. Handlebars is the default. |
| ext    | extension to be used for dest files. |
Renders to:
| Option | Description |
|---|---|
| data | path to data files to supply the data that will be passed into templates. |
| engine | engine to be used for processing templates. Handlebars is the default. |
| ext | extension to be used for dest files. |
Footnotes
Markdown footnotes are not officially defined by the CommonMark specification. However, the feature is supported by remarkable and other markdown parsers, and it's very useful when available.
Markdown footnotes are denoted by an opening square bracket, followed by a caret, followed by a number and a closing square bracket: [^1].
This is some text[^1] with a footnote reference link.
The accompanying text for the footnote can be added elsewhere in the document using the following syntax:
[^1]: "This is a footnote"
When rendered to HTML, footnotes are "stacked" by the markdown parser at the bottom of the file, in the order in which the footnotes were defined.
Inline footnotes
Some markdown parsers also support inline footnotes. Inline footnotes are written using the following syntax: [^2 "This is an inline footnote"].
How to install Mkdocs
Install Python
Install Python (and many libraries) via Anaconda
Install Mkdocs
- Download
requirements.txt. - Launch
Anaconda Prompt. -
Execute:
pip install virtualenv virtualenv venv source venv/bin/activate pip install -r requirements.txt -
It should install a few packages, e.g.:
- mkdocs
- mkdocs-awesome-pages-plugin
- mkdocs-localsearch
- mkdocs-material
- mkdocs-material-extensions
- mkdocs-print-site-plugin
- pymdown-extensions
More info on https://www.mkdocs.org
Create a test project with MkDocs
In a terminal:
cd Desktopmkdocs new TestProjectcd TestProjectmkdocs serve
Open http://localhost:8000/ in your browser.
- Edit
mkdocs.ymlfile. - Add Markdown files in
docs/folder - Add sub-folder in
docs/folder - They should appear automatically in http://localhost:8000/
Work on SimStadt documentation
- Install Markdown editor
- Install MkDocs + Plugins
- Get simstadt_doc
- Create SSH key if needed
- Send it to Eric
git clone git@simstadt_server:simstadt_doc
Markdown Editors
Typora

Download installer here. (mirror)
NotePad++ with Plugin
NotePad++ (mirror) and MarkdownViewer++. More info here.
Online
How to create diagrams
Mermaid Diagrams
Graphs
```mermaid
graph LR;
A-->B;
A-->C;
B-->D;
C-->D;
```
Sequence diagrams
```mermaid
sequenceDiagram
participant Alice
participant Bob
Alice->>John: Hello John, how are you?
loop Healthcheck
    John->>John: Fight against hypochondria
end
Note right of John: Rational thoughts <br/>prevail!
John-->>Alice: Great!
John->>Bob: How about you?
Bob-->>John: Jolly good!
```
Class diagrams
```mermaid
 classDiagram
  Animal <|-- Duck
  Animal <|-- Fish
  Animal <|-- Zebra
  Animal : +int age
  Animal : +String gender
  Animal: +isMammal()
  Animal: +mate()
  class Duck{
      +String beakColor
      +swim()
      +quack()
  }
  class Fish{
      -int sizeInFeet
      -canEat()
  }
  class Zebra{
      +bool is_wild
      +run()
  }
```
Large example
How to display code
Inline code
Just use `:::java List<String> places = Arrays.asList("Buenos Aires", "Córdoba", "La Plata");`
or `:::ruby (1..10).map{|i| i*i}.join('->')`
Just use List<String> places = Arrays.asList("Buenos Aires", "Córdoba", "La Plata");
or (1..10).map{|i| i*i}.join('->')
Syntax highlighting
```python
s = "Python syntax highlighting"
print s
```
s = "Python syntax highlighting"
print s
Java example
```java
public class MonthlyHeatingAndCoolingDemandAnalysisTests
{
        enum Location {
                GERMANY, NYC
        }

        private static final String VERY_LARGE_NYC_BUILDING_TYPE = "Commercial, very large NYC";
        private static final String NON_HEATED_ALKIS_CODE = "2463"; // Garage
        private static final String NO_DHW_ALKIS_CODE = "31001_3072"; // Hall/Firestation
        private static final double MINIMUM_SPECIFIC_HEATING_DEMAND = 50; // [kWh/m².a]
        private static final double MINIMUM_SPECIFIC_COOLING_DEMAND = 25; // [kWh/m².a]

        private final HeatDemandAnalysisWorkflowProvider mebWorkflowProvider = new HeatDemandAnalysisWorkflowProvider();
        private static final int COMMON_VALUES_COUNT = 39;
        private static final int HEATING_VALUES_COUNT = 14;
        private static final int COOLING_VALUES_COUNT = 14;

        @Test
        public void testDIN18599InGruenbuehl() throws Exception {
                testDIN18599InBadenWuerttemberg("Gruenbuehl", "Gruenbuehl_LOD2_ALKIS_1010", 105, LOD.LOD2, false);
        }
}
```
public class MonthlyHeatingAndCoolingDemandAnalysisTests
{
        enum Location {
                GERMANY, NYC
        }

        private static final String VERY_LARGE_NYC_BUILDING_TYPE = "Commercial, very large NYC";
        private static final String NON_HEATED_ALKIS_CODE = "2463"; // Garage
        private static final String NO_DHW_ALKIS_CODE = "31001_3072"; // Hall/Firestation
        private static final double MINIMUM_SPECIFIC_HEATING_DEMAND = 50; // [kWh/m².a]
        private static final double MINIMUM_SPECIFIC_COOLING_DEMAND = 25; // [kWh/m².a]

        private final HeatDemandAnalysisWorkflowProvider mebWorkflowProvider = new HeatDemandAnalysisWorkflowProvider();
        private static final int COMMON_VALUES_COUNT = 39;
        private static final int HEATING_VALUES_COUNT = 14;
        private static final int COOLING_VALUES_COUNT = 14;

        @Test
        public void testDIN18599InGruenbuehl() throws Exception {
                testDIN18599InBadenWuerttemberg("Gruenbuehl", "Gruenbuehl_LOD2_ALKIS_1010", 105, LOD.LOD2, false);
        }
}